|
In the July 2023 update, Oracle Analytics Cloud has introduced a new feature called AutoML. Oracle AutoML, or Oracle Automated Machine Learning, is a feature within the Oracle Cloud Infrastructure (OCI) platform that has been accessible within OCI in the Autonomous Database. Its main objective is to automate the process of developing and deploying machine learning models. AutoML is designed to simplify and accelerate the model building process, particularly for users who may not have extensive expertise in data science or machine learning. What exactly is AutoML? Oracle AutoML provides a user-friendly interface that allows users to upload their data, specify the target variable they want to predict or classify, and set various model configuration options. The platform then automatically explores different algorithms, feature transformations, and hyperparameter settings to find the best-performing model for the given task. The AutoML process involves several steps, such as data preparation, feature engineering, model selection, hyperparameter tuning, and model evaluation. Oracle AutoML takes care of these steps behind the scenes, leveraging advanced techniques and computational resources to optimise the model building process. Once the best model is identified, Oracle AutoML enables users to deploy the model for real-world use cases. The deployed model can be integrated into applications or used for making predictions and decisions based on new data. Overall, Oracle AutoML aims to democratize the use of machine learning by automating complex tasks and reducing the need for specialized knowledge. It enables users to leverage the power of machine learning without the extensive time and effort typically required for model development, allowing them to focus more on deriving insights and value from their data. AutoML in Oracle Analytics CloudAutoML has now been embedded in Oracle Analytics in the July 2023 update enabling users with no prior Machine Learning experience to use the right models with the correct hyperparameter settings. 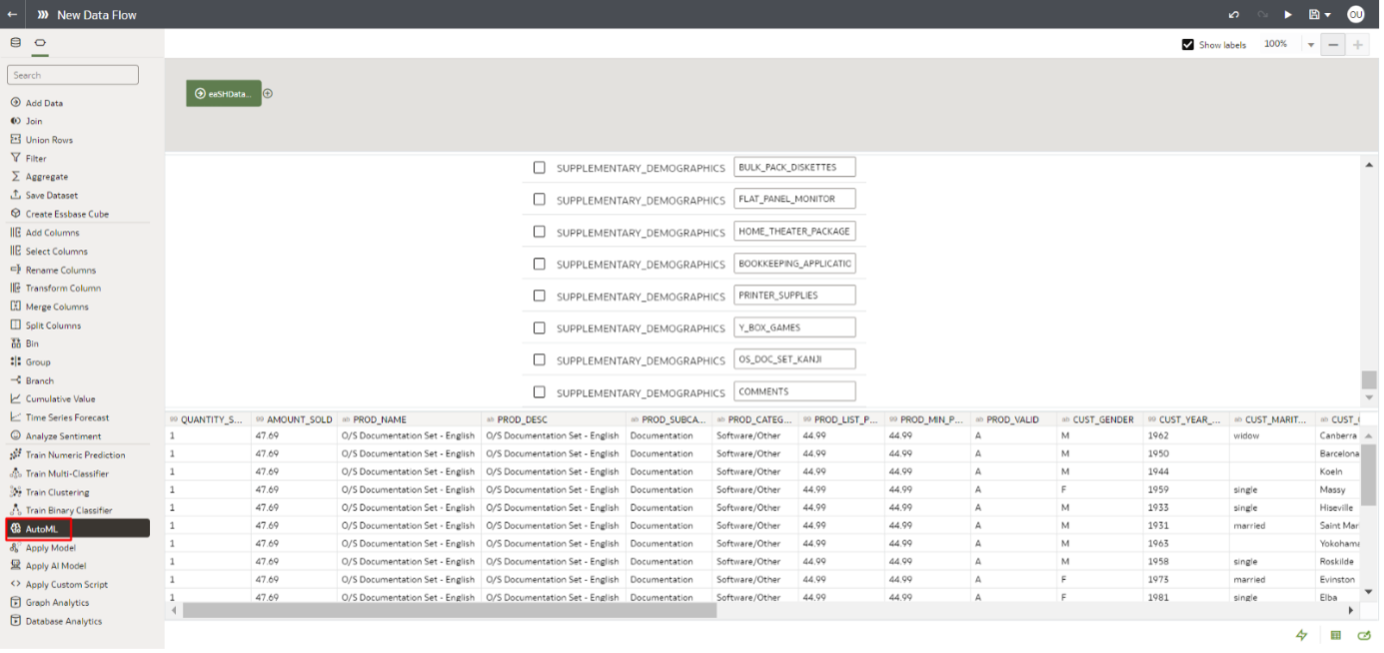 You add a dataset to a data flow which has the data with the field to be predicted. The next step is to add the new AutoML step. 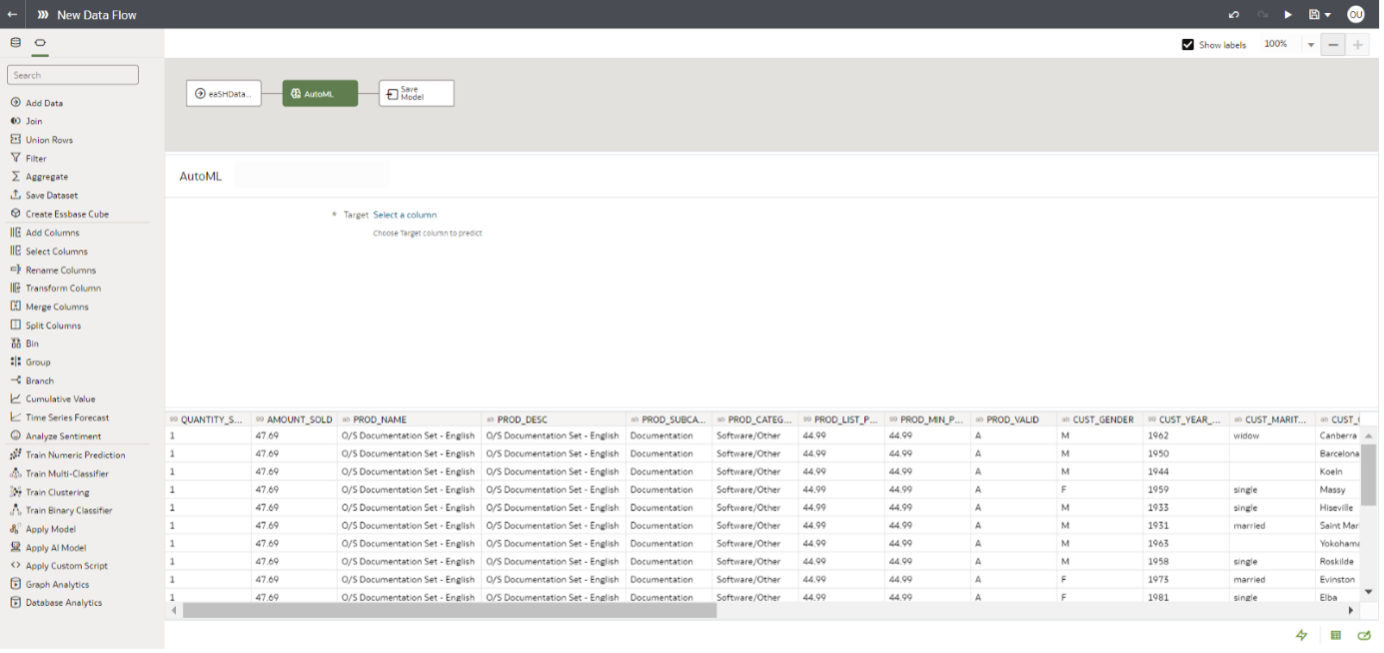 All you must do in this step is to specify the column that needs to be predicted and Oracle Analytics will automatically determine which type of model is best suited for the selected column. 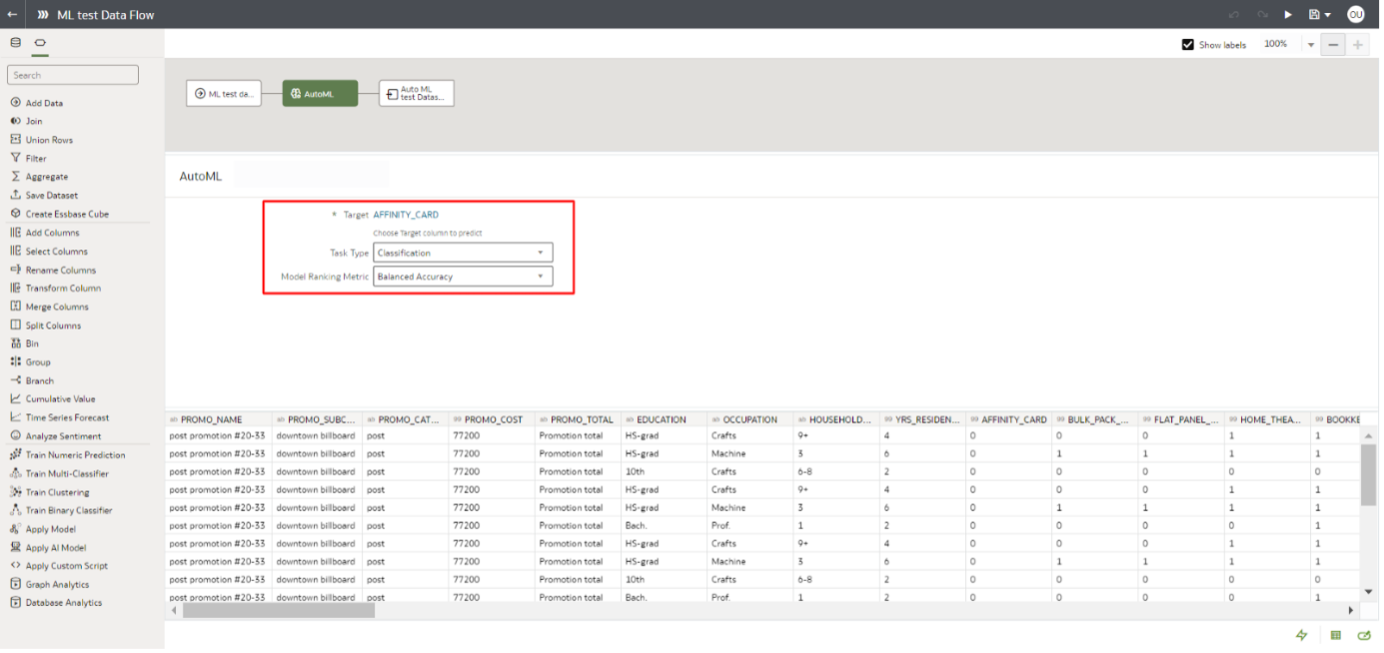 The final step in all data flows as usual is to “save model”. The data is saved into a dataset, in this case, it is saved to a machine learning model called AutoML test Dataset as below: 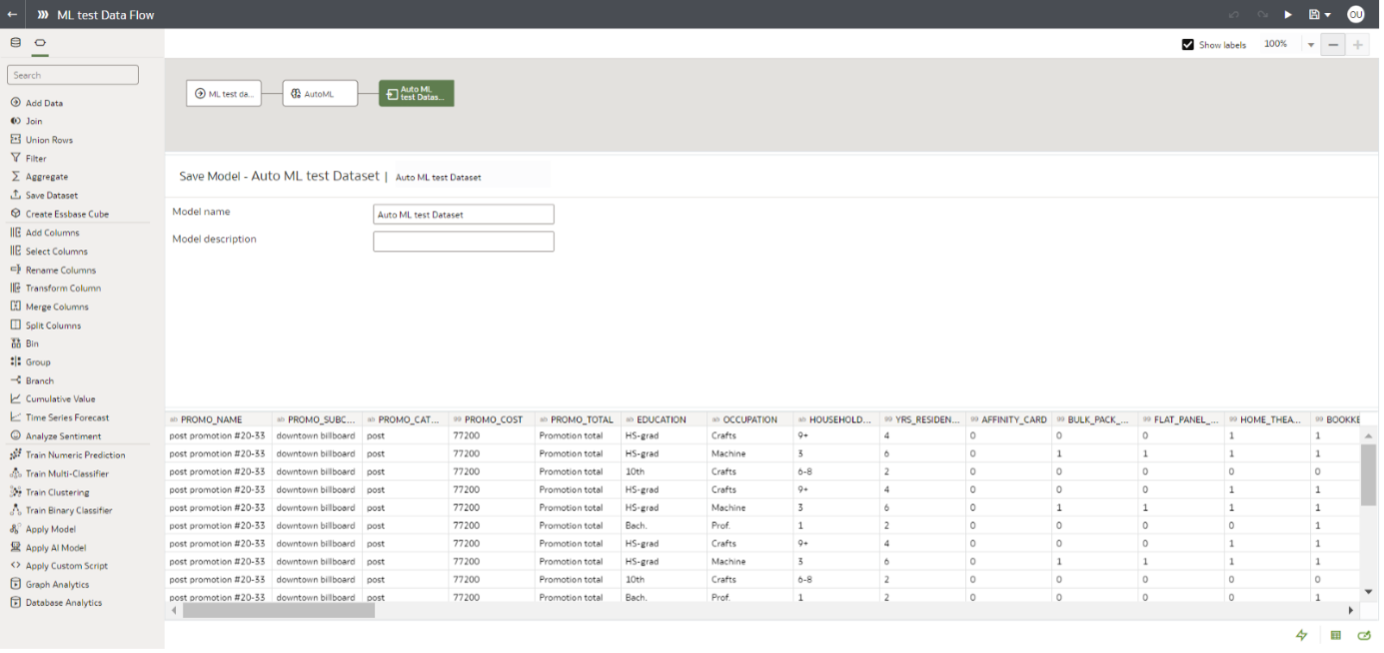 Once this is completed, the machine learning model is available to be run on a data set. You can find the new model in the Machine Learning section of the main menu: Right clicking on the model and selecting the Inspect menu option gives you more information about the ML model. 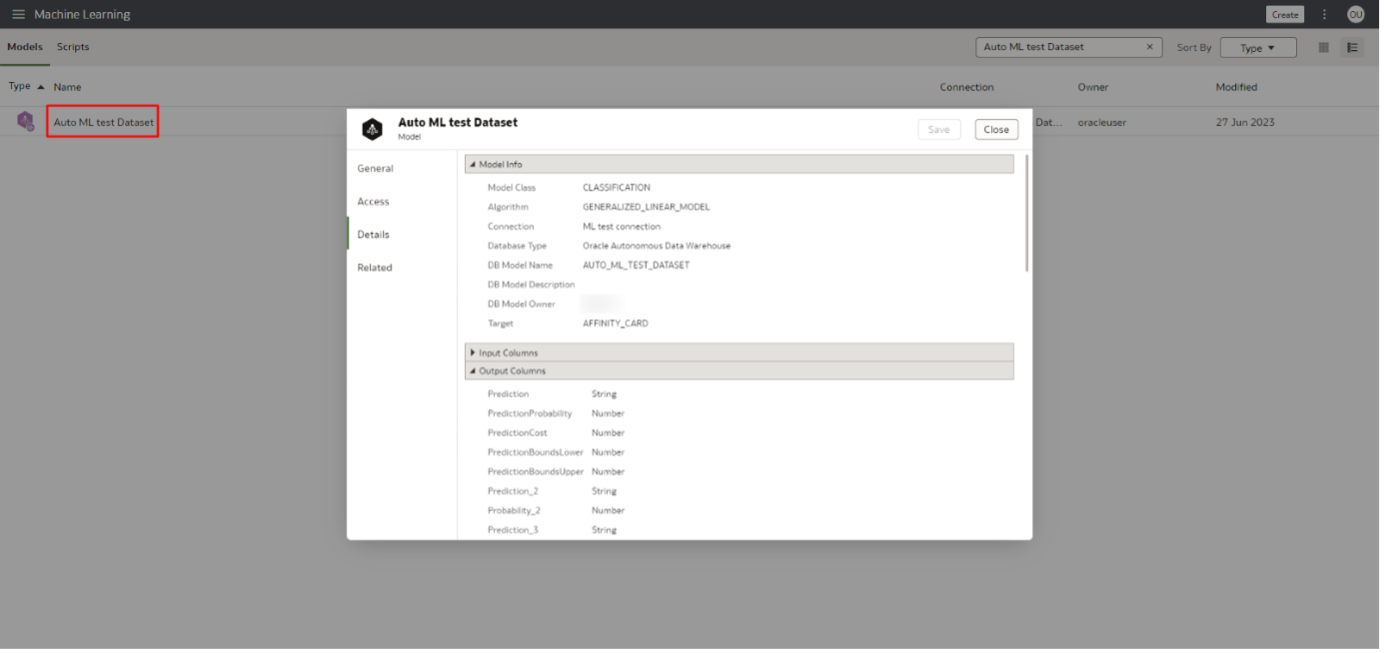 The final stage of the process is to now use the ML model created in the data flow and apply it to an actual data set.
Pre-requisites Whilst I was looking at the AutoML feature, there were a number of issues that I came across that I have noted below. The database user of the connection in Oracle Analytics should have limited privileges. These privileges should include:
The AutoML process will fail if the database user of the connection has DBA administrator privileges. You will see an error message similar to this excerpt: Step |j| Execution failed. Status: FAILED. Message: Error Message: Failed to create remote AutoML JOB Error: {'errorMessage': user not allowed to run scripts', 'errorCode': 1026} You should allocate enough OCPUs to your database for AutoML jobs to complete successfully. In my experience, AutoML jobs have failed to complete with 1 OCPU. The database should also have sufficient tablespace storage. If the storage space is insufficient, you will see an error message like this excerpt below: Step |j| Execution failed. Status: FAILED. Message: Error Message: The remote AutoML job failed due to a bad request. Message: {"Unexpected Script Execution Error":"ORA-65114: space usage in container is too high: Conclusion The latest AutoML updates make cutting-edge ML more accessible than ever before in Oracle Analytics Cloud. Organisations can now rapidly build and deploy accurate models to turn data into actionable insights with ease. By putting Machine Learning in the hands of more users, the new AutoML feature helps to promote a culture of collaboration and innovation with data across the enterprise unlocking transformative ways in which organisations can leverage AI to create value and drive growth.
0 Comments
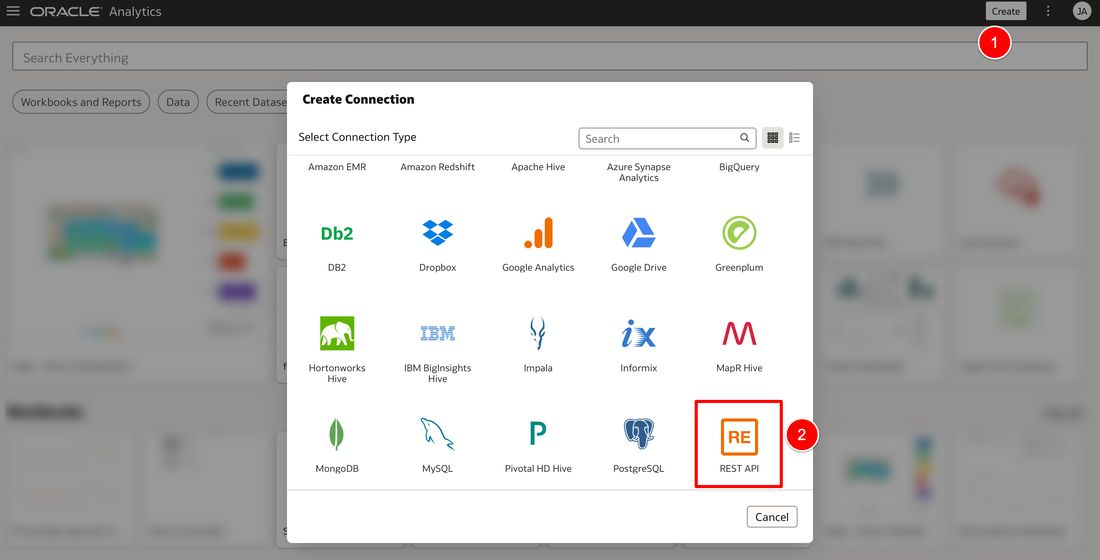
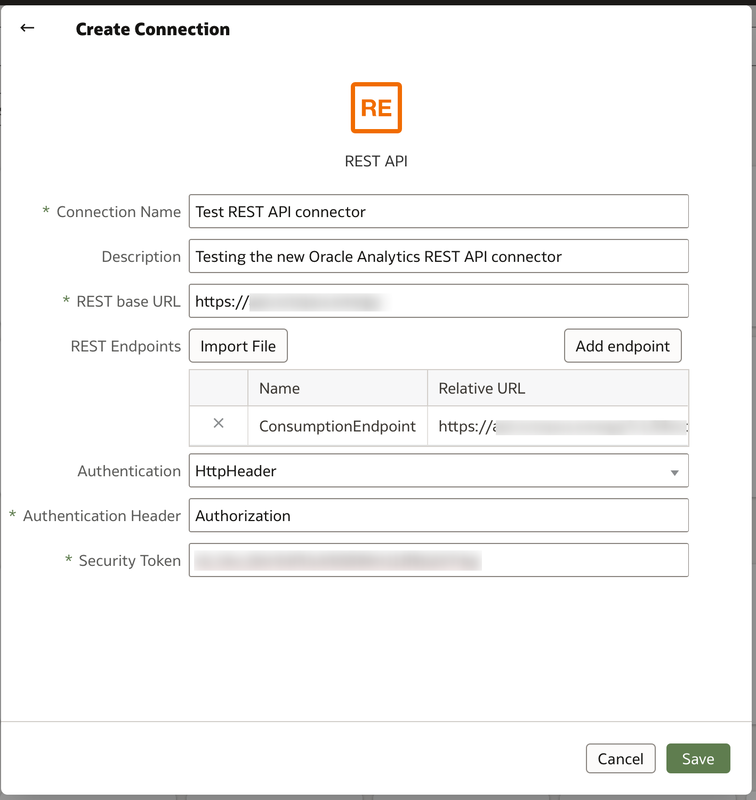
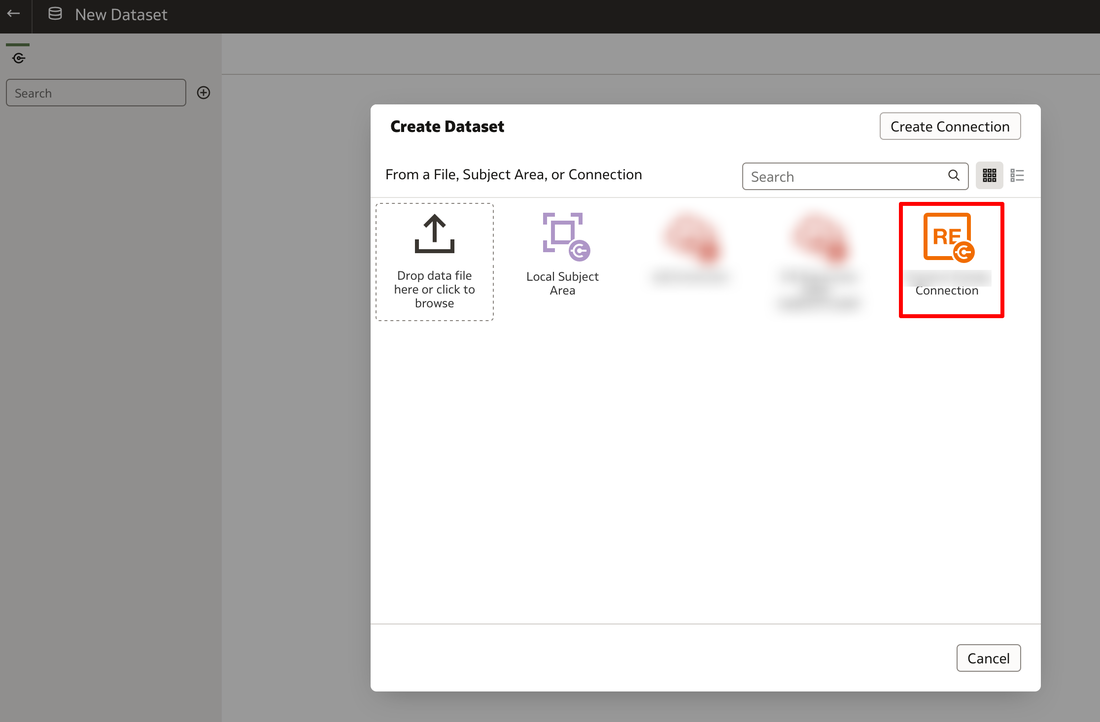
The Oracle Analytics REST API Connector is now available in the September 2022 Oracle Analytics update in preview mode. The connector now allows access to data directly from REST API endpoints. To access the REST API Connector, you will need to enable the feature in the Console System Settings preview section by switching on the toggle. You will need to log off and back on again to apply the change to your instance. You should now see the REST API connector in the create > connections menu on the Oracle Analytics homepage. In the next screen, you enter details of your REST API that you want to access. The basic information required for connecting are:
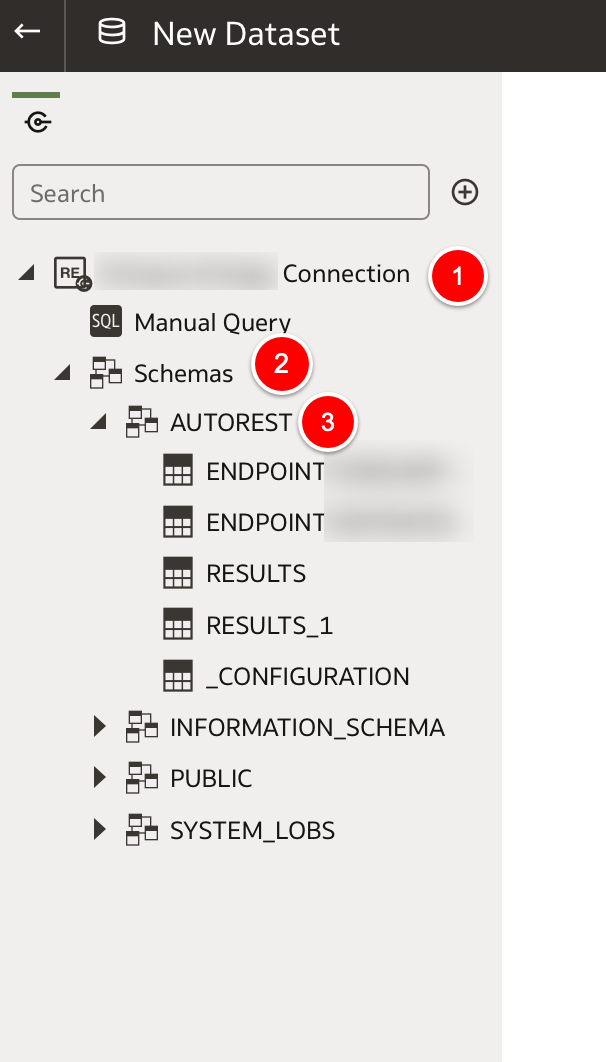
You can either enter the information in here directly or you can use a JSON template to enter all of the REST API information. A sample JSON template file can be found at the bottom of this post. If you decide to enter information of the REST API for your connector using a JSON file, you will need the contents to match the syntax below. If your API has several endpoints that you will be using then enter each endpoint URL in the endpoints section. Ensure that the correct authentication type is entered. Once all completed, the connection can be used as a standard connection to create a dataset. . During the testing of this new functionality, the REST API used BasicAuth authentication and the API key was supposed to be entered in the username field. The issue here is that the password is a mandatory field and can't be left blank. The way round this was to re-enter the API key in the password field as well. Once the connection has been created, you can create a dataset using the REST API connection in the normal fashion. In the connection panel of the New Dataset window expand the REST API connection to the AUTOREST schema to access the result sets of the endpoints. The RESULTS tables contain the data from the endpoints and the others contain metadata of the endpoints. The new REST API connector is a great addition to the Oracle Analytics capability. It now gives users another means of bringing additional data in to uncover even more insights from your enterprise data assets.
This website uses marketing and tracking technologies. Opting out of this will opt you out of all cookies, except for those needed to run the website. Note that some products may not work as well without tracking cookies. Opt Out of Cookies
Photo by Isaac Smith on Unsplash
The Oracle Analytics team have been busy working on the latest version of Oracle Analytics Cloud - 5.9 which is packed with a number of interesting features and enhancements that we'll cover in some detail in this blog post.
Real Estate
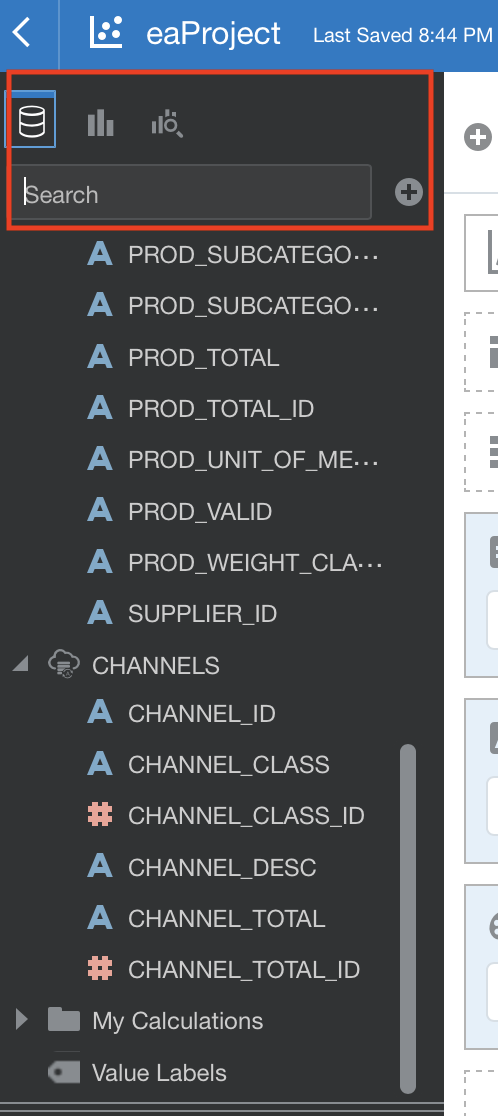
There is now a permanent Search field and smaller Data, Visualisations and Analytics icons which have been relocated to the top of the side bar. This results in the reduction of wasted space on the left of the side bar.
Progress Bars
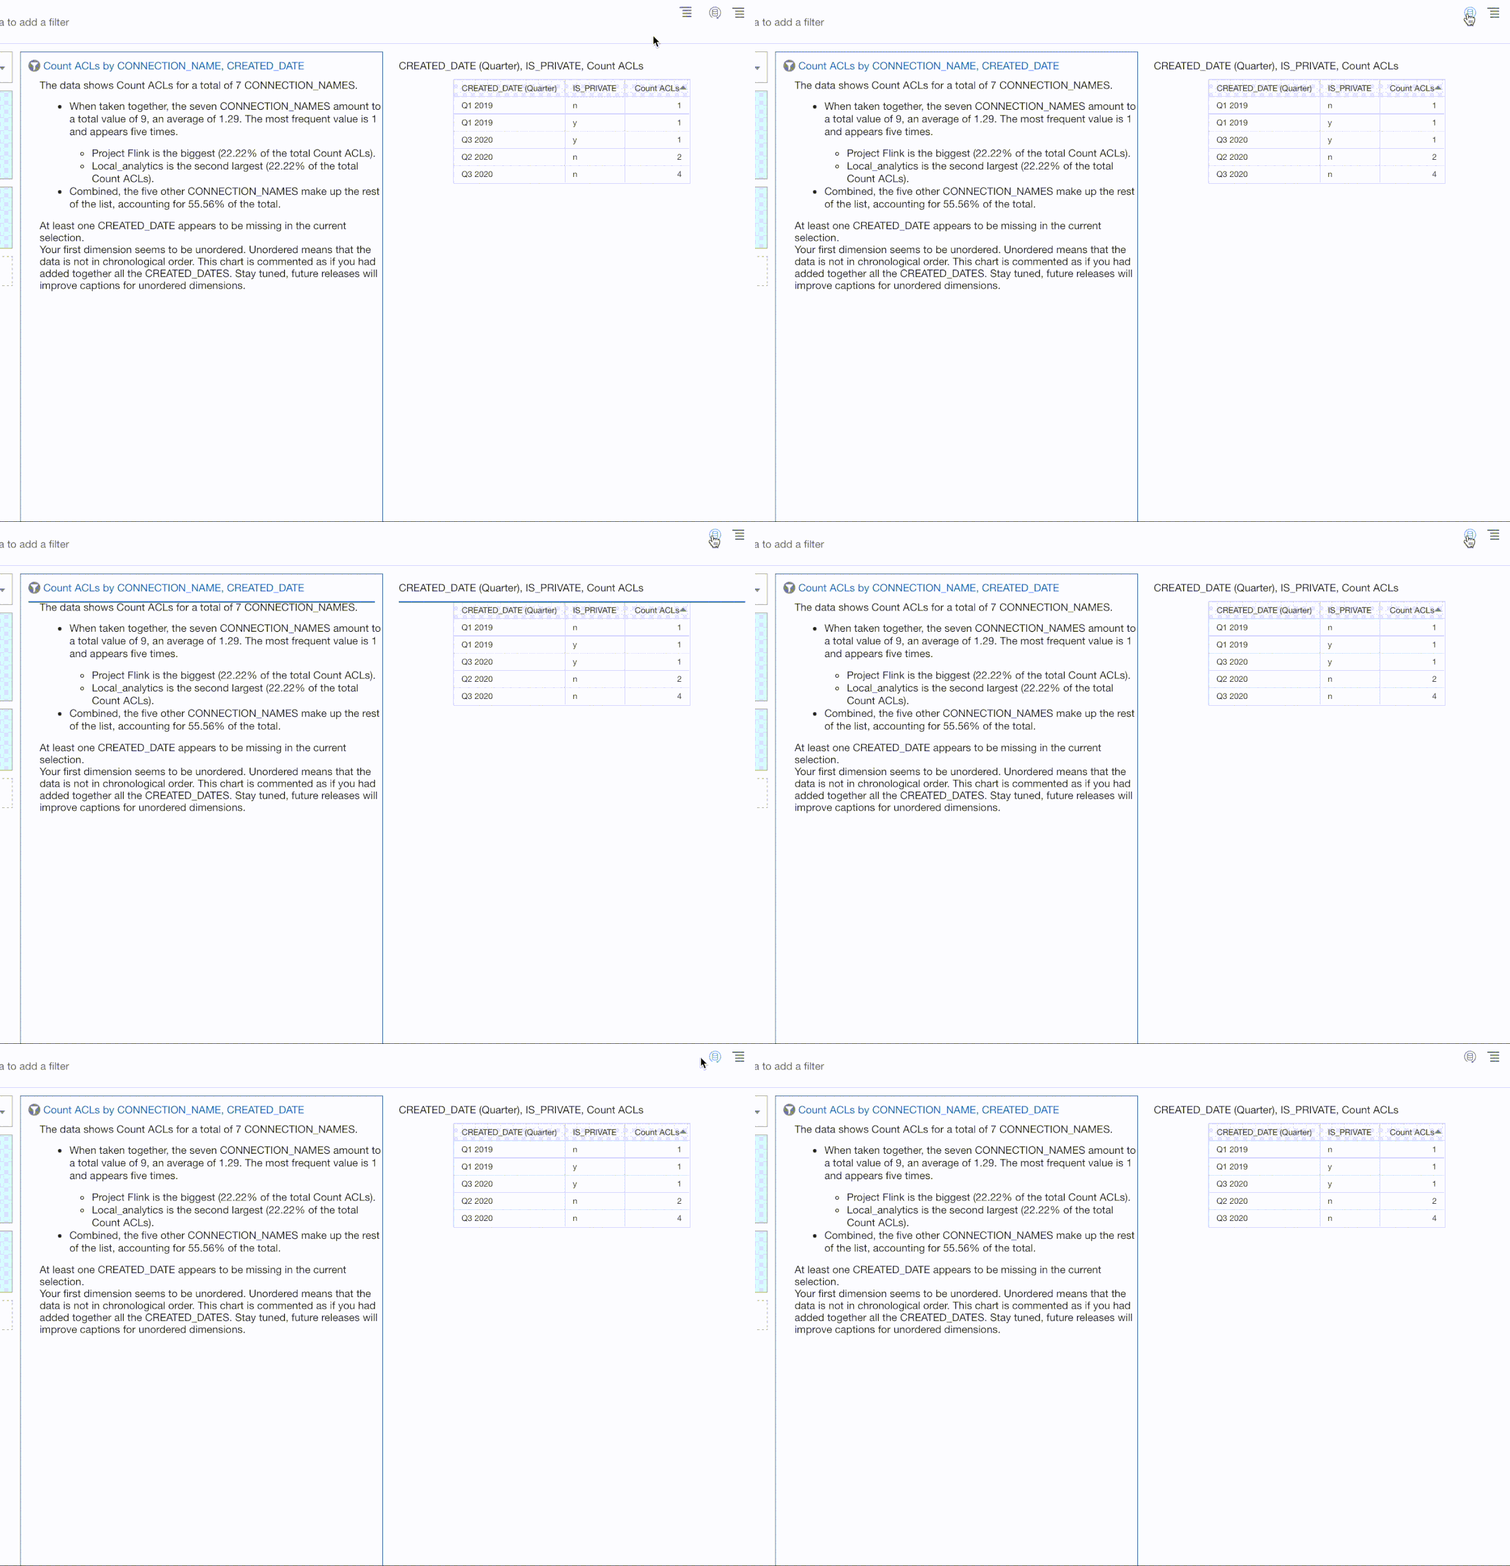
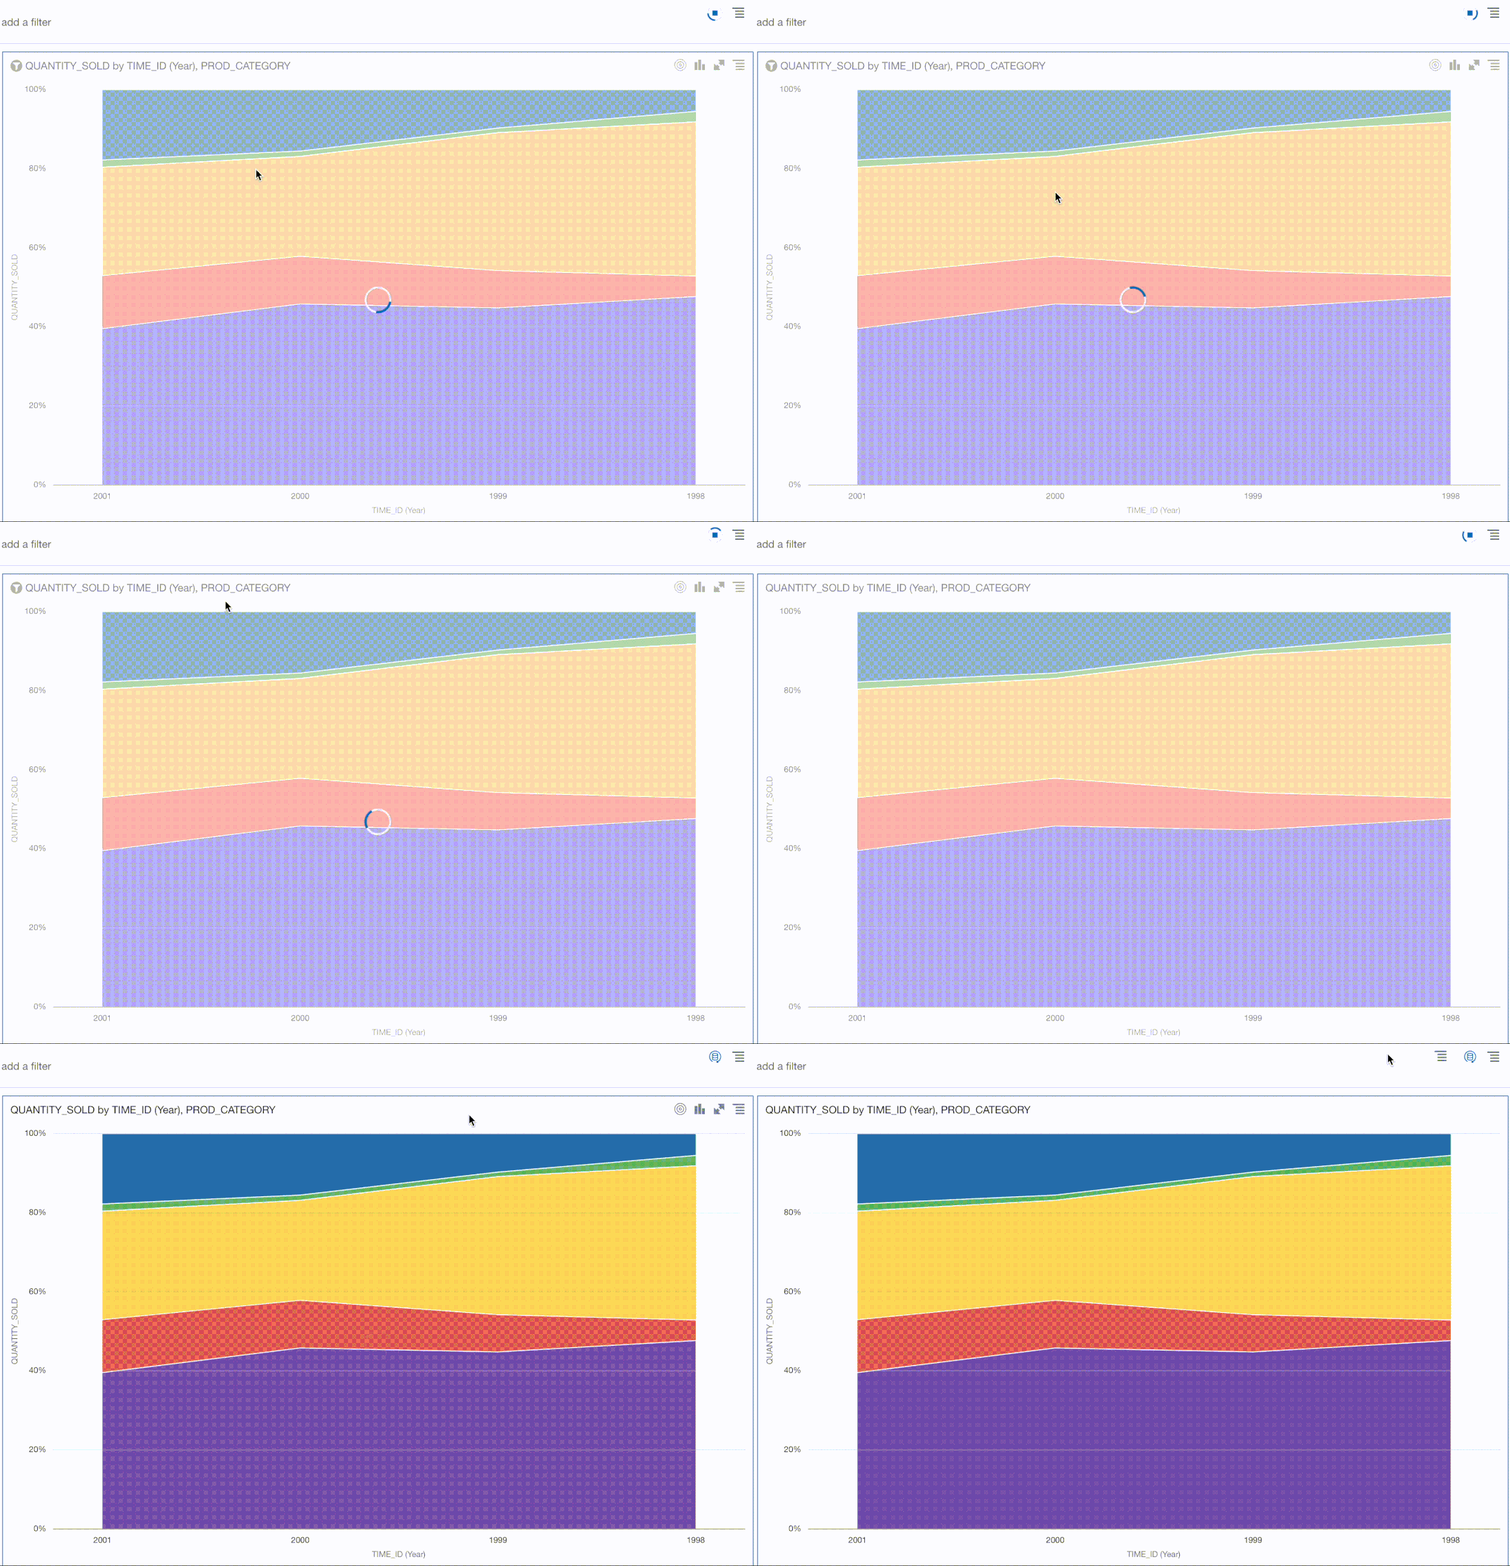
The animated progress bars that are displayed when visualisations and data are loaded have been updated.
The thin blue horizontal progress bars that were visible in previous Oracle Analytics versions across the screen when a. visualisation or canvas was refreshed have been changed as you can see in the images above.
Data Preparation
TRIM Function
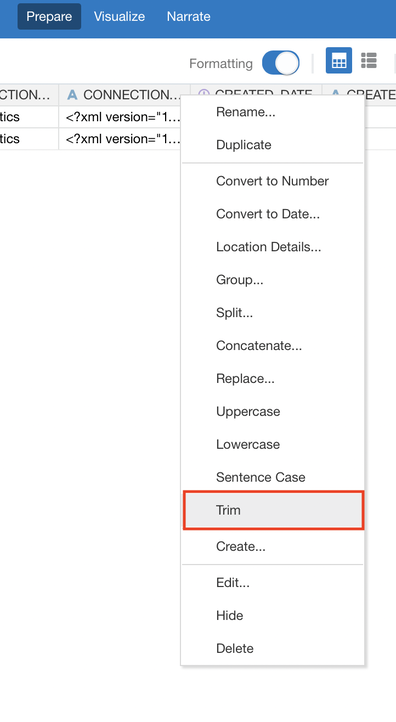
There is now one click access to TRIM whitespace from a text column in the Data Preparation stage of Data Visualisation. This removes whitespace from both sides of the selected column
US ZIP Codes
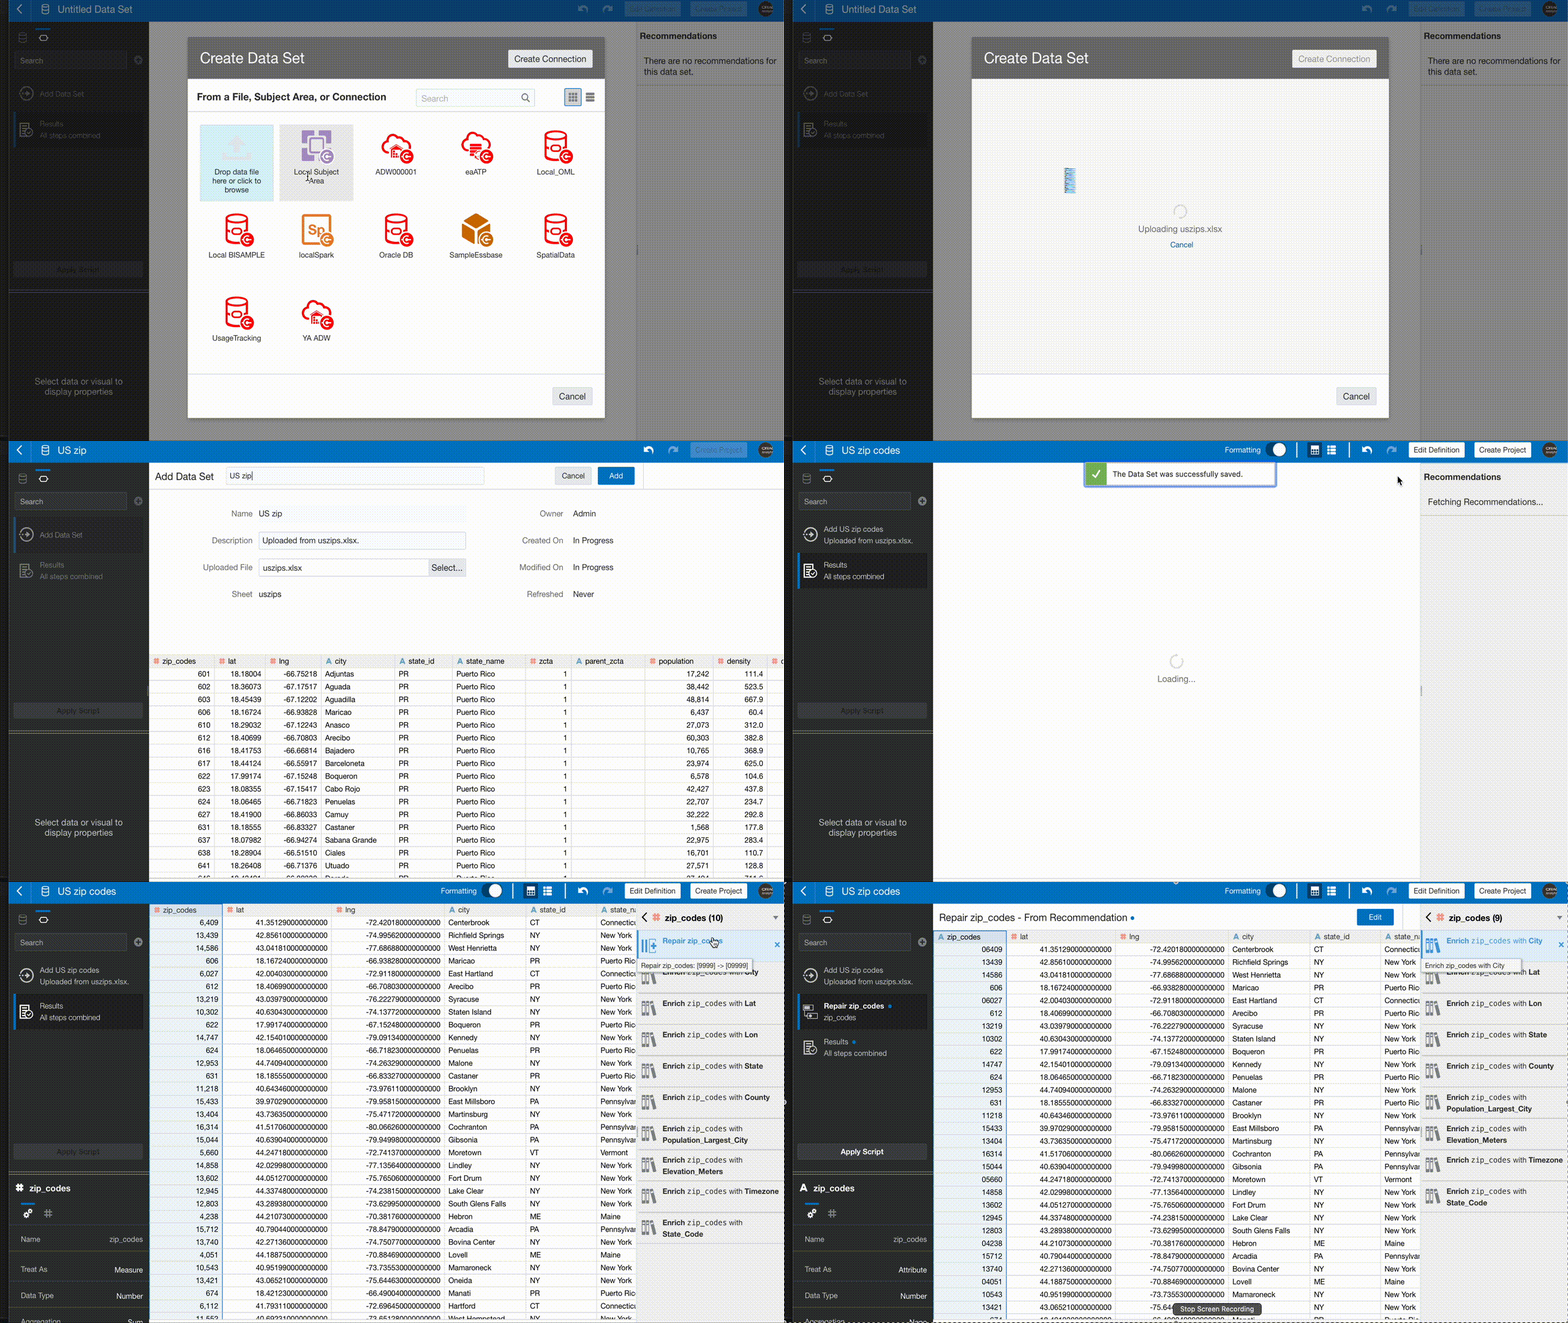
This new feature is available in a column that contains ZIP code data. Oracle Analytics suggests a recommendation step to repair any of the ZIP codes that have missing leading zeros.
Filter Enhancements
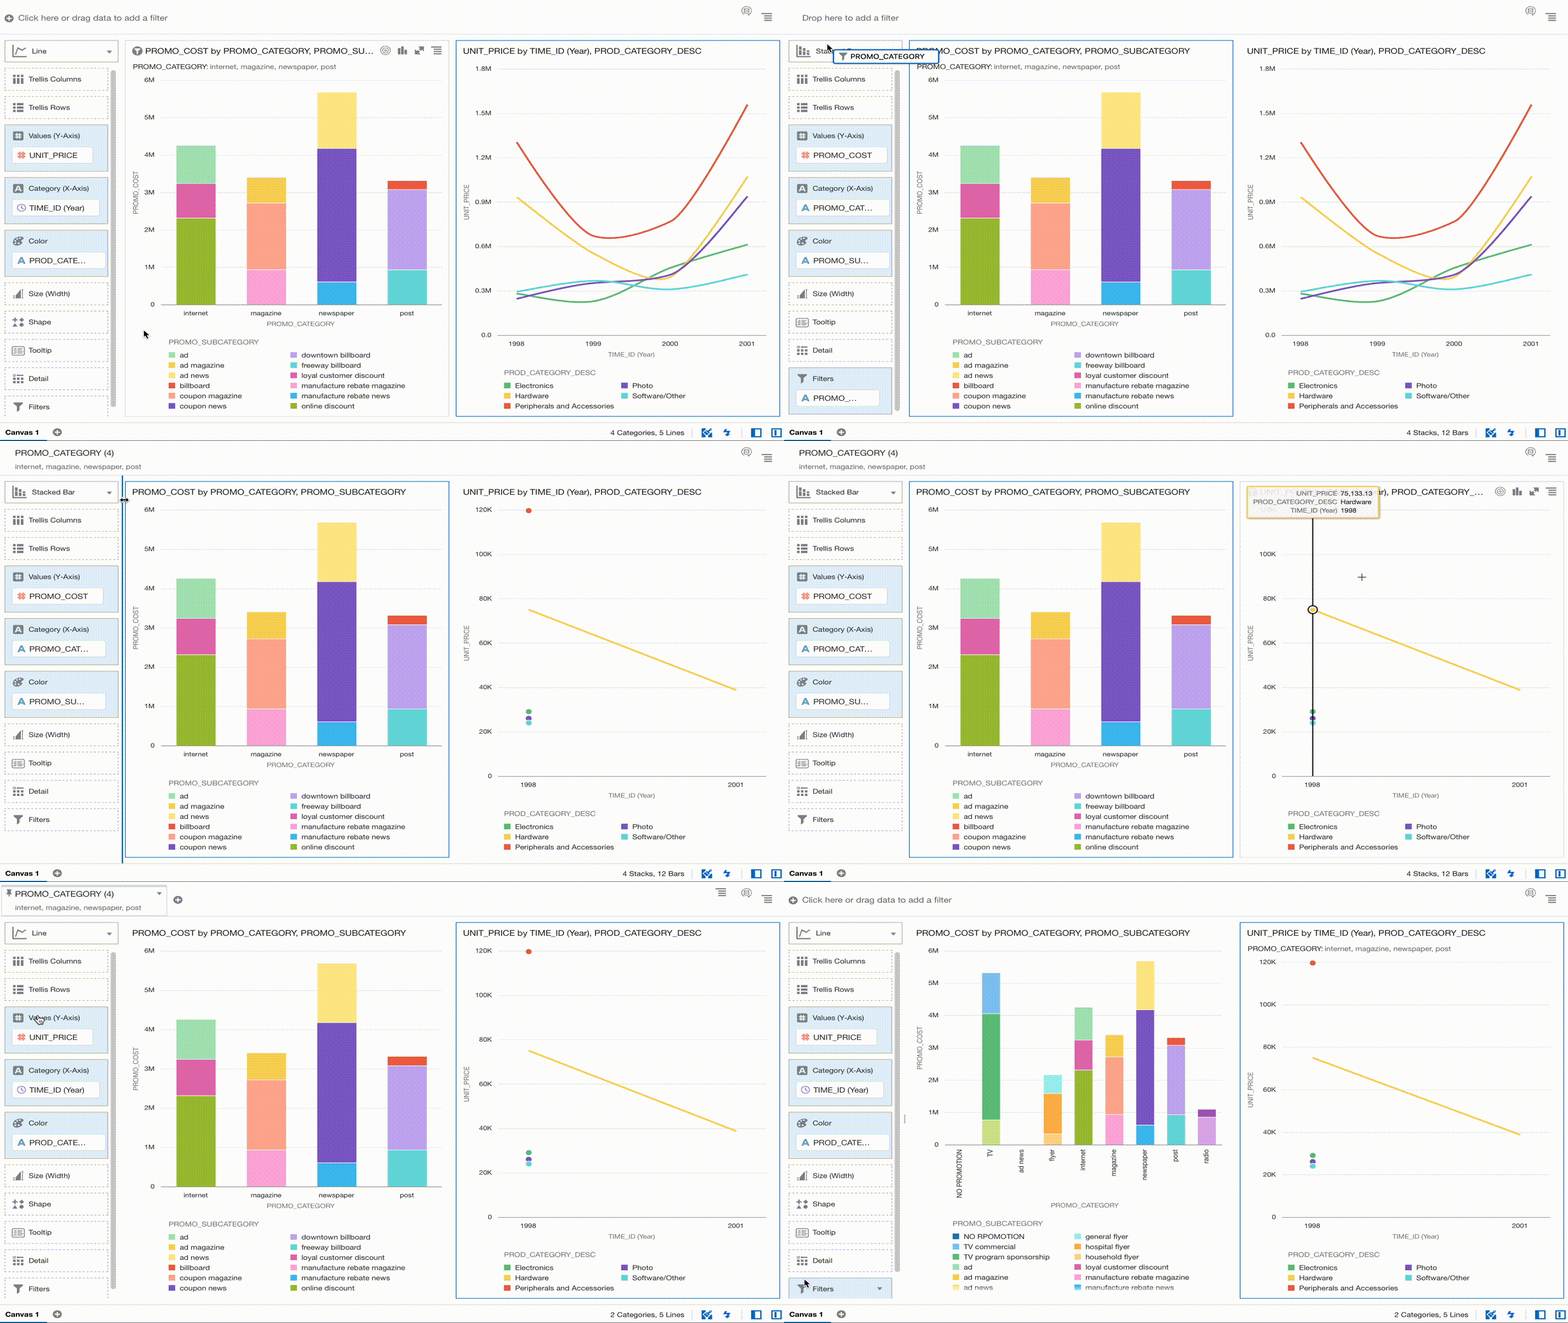
You can now move a Visualisation level filter to the Canvas level by simply dragging it from the side bar to the Canvas level filter section. You can also do the opposite; moving a filter from the Canvas level to a specific Visualisation.
Sorting Enhancements
There is now the capability in OAC 5.9 to sort by multiple dimensional attributes. In the screenshot below, you can see that the state_name and county_name have sorts defined. Columns added to the Size and Tooltip of a visualisation can also be included in the visualisation sorting.
You can also sort by a measure but note that this will overwrite any dimensional attribute sorting that has been previously defined for the visualisation.
Export Limits For those who still export data dumps to Excel ?, row limits have been increased. Formatted exports that include XLSX, PPTX, HTML and PDF files have been increased to 400,000 rows with instances that have 16-52 OCPUs. Instances with 2-12 OCPUs will have their limit increased to 200,000 rows. The limits of unformatted report exports (XML, Tab Delimited and CSV) have been increased to 2,000,000 rows for instances with 2-12 OCPUs. Instances with 16-52 OCPUs will see their limits rise to 4,000,000 rows. Area Visualisation Enhancements
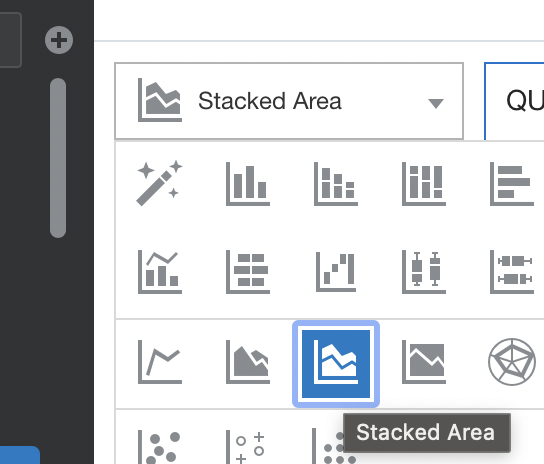
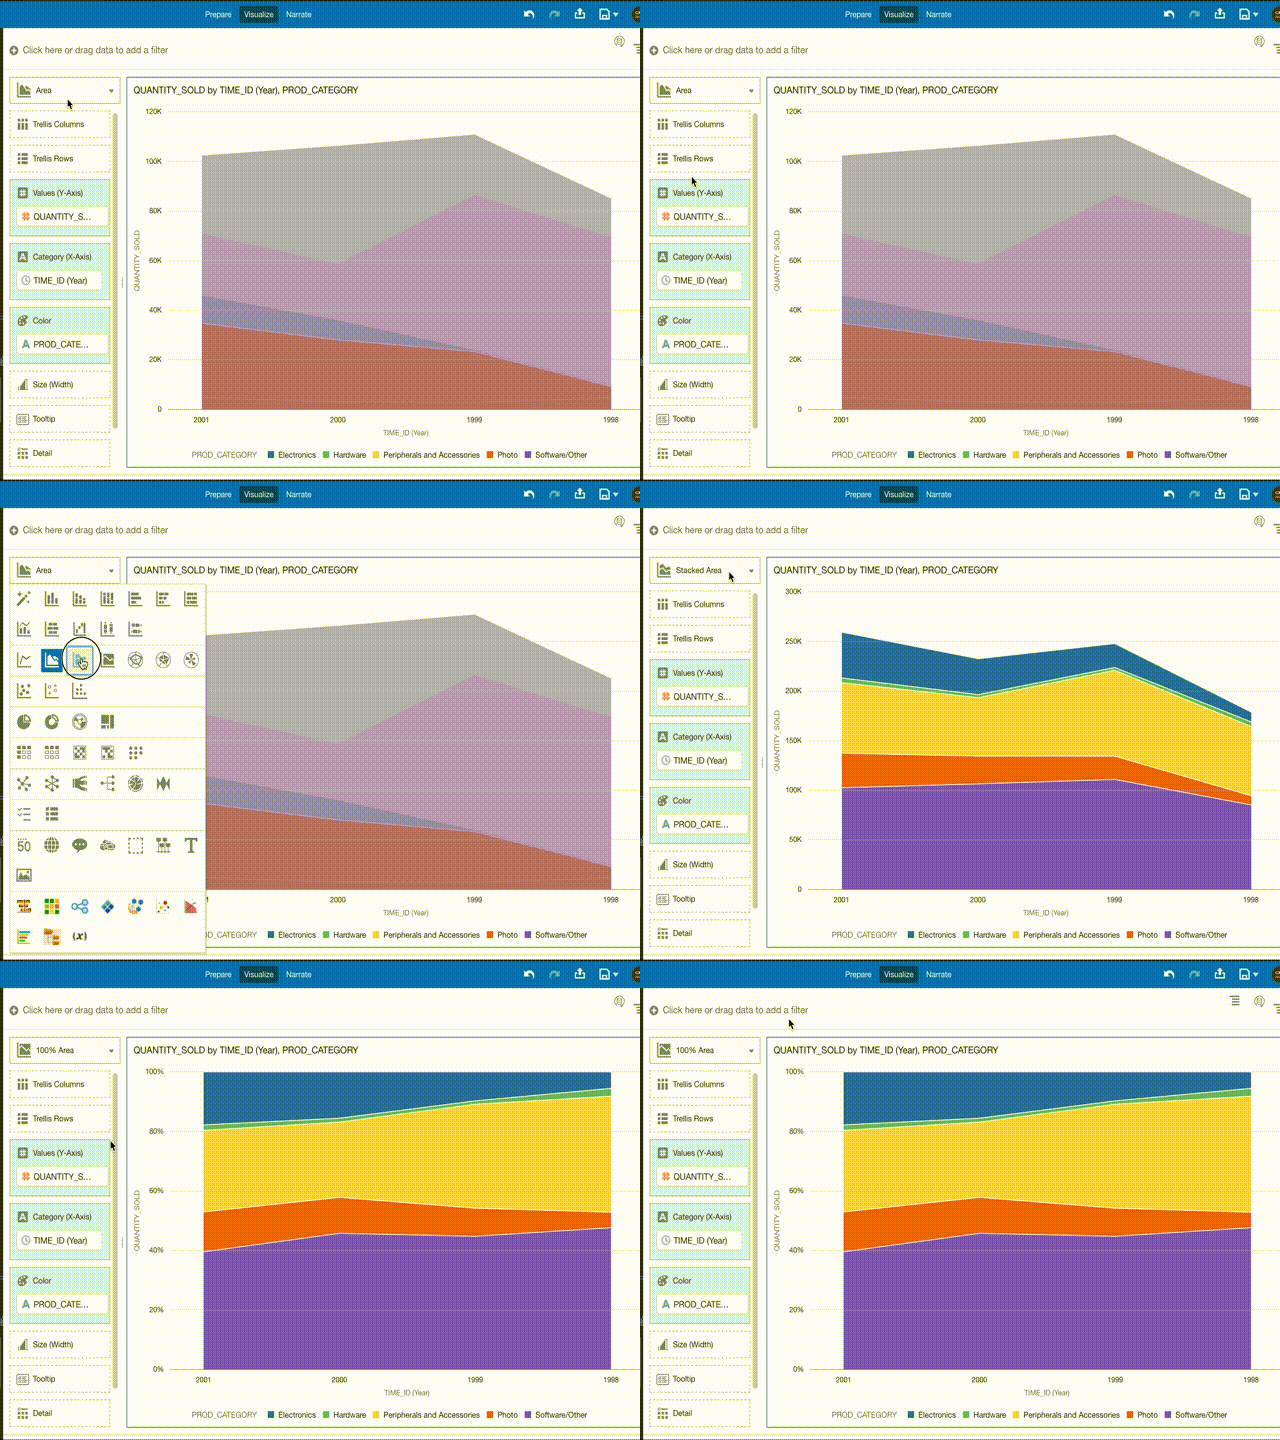
There were previously 2 Area Visualisations in versions of Oracle Analytics prior to version 5.9. There are now 3 types; Area, Stacked Area and 100% Area.
I personally think that the new Stacked Area visualisation is more "visual" and users can gain a quicker insight visually.
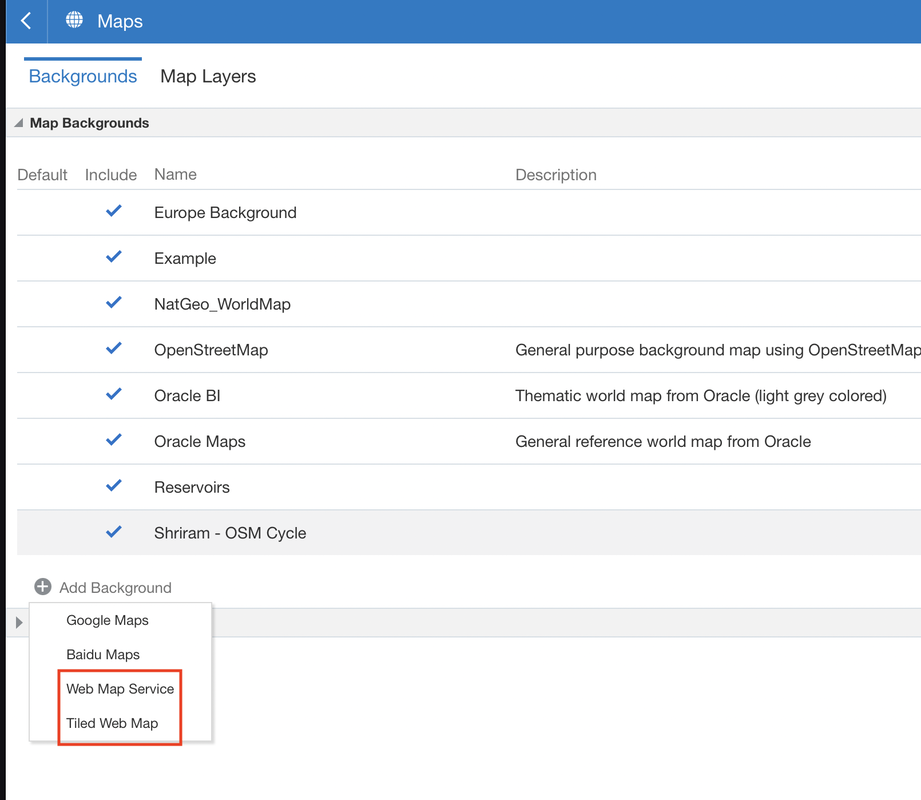
New Mapping Options
These new map backgrounds give users more flexibility with their map visualisations.
Machine Learning
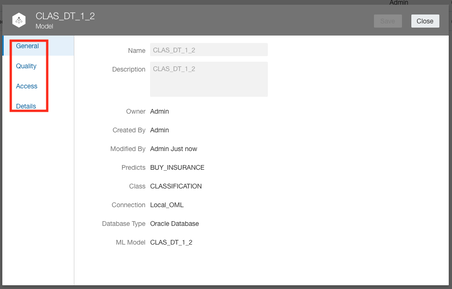
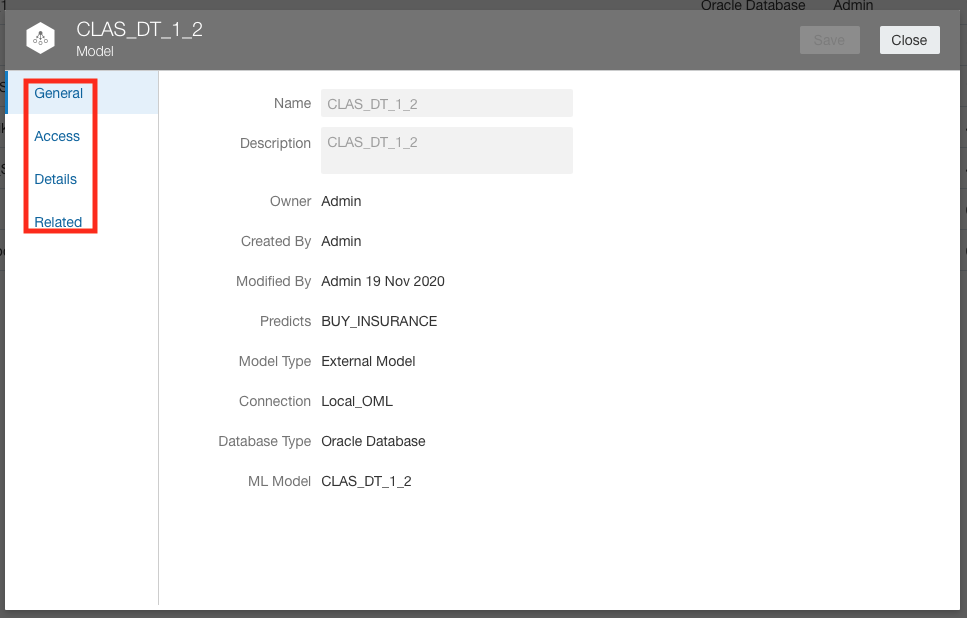
It can be useful to gain some insights into the Machine Learning models that Oracle Analytics uses. There have been some enhancements added to the Oracle Machine Learning (OML) inspect tab which exposes much more metadata about the Machine Learning model.
There has been some renaming and reorganising of the tabs available in the Machine Learning Inspect window. The Details tab contains basic information about the Oracle Machine Learning model including input and output columns.
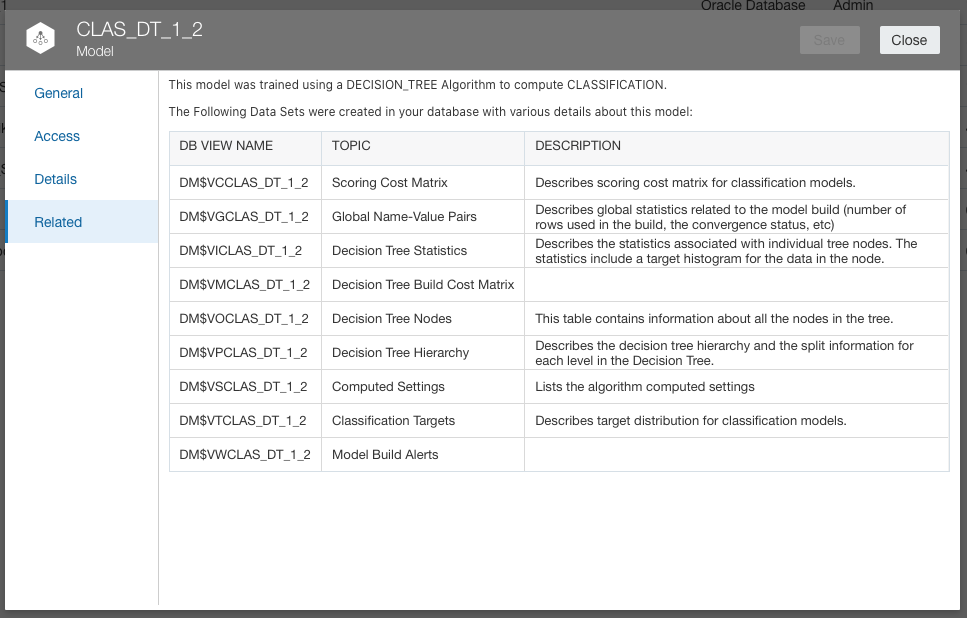
The Related tab now shows in-depth information of the Oracle Machine Learning model which is stored in database metadata views.
You can even access these views and build out visualisations to gain further insights and understanding of the Machine Learning models that you are using in your Analytics.
The Oracle Analytics team have put together a YouTube video about it which you can view below. Text Tokenization
In previous versions of Oracle Analytics, Text Tokenization was indirectly available. OML ADW capabilities could be used. Francesco Tisiot recently blogged about this with a good example demonstrating a typical use case for textual analytics.
In Oracle Analytics Cloud 5.9, Text Tokenization is natively available as a data flow step thereby taking away the need to access the ADW instance in order to create a context index on the text column to be analysed and then to link the tokens to the text field in your data that is being analysed. This is now done for you automatically.
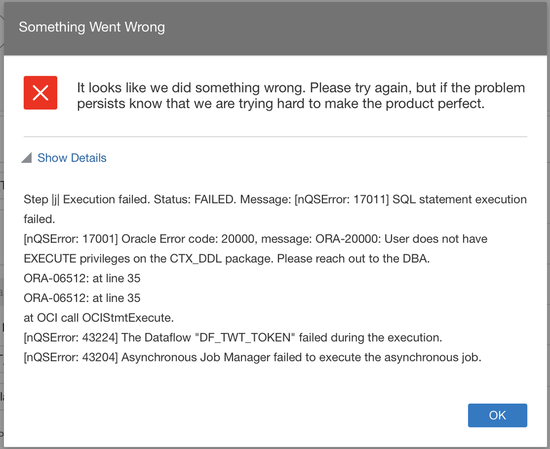
The Text Tokenization functionality only works with Oracle sourced datasets - ATP, ADW and Oracle On-Premise Databases. It makes use of the Oracle Text database functionality and the Database Analytics data flow step is only available for these Oracle sourced datasets. In order to avoid this error:
Ensure that your user account that you use for the connection to the database has the correct privileges:
Conclusion
As you will have gathered, this 5.9 release of Oracle Analytics Cloud comes packed with a wide range of features and enhancements. The release is typically staggered whilst the upgrade is applied to the Oracle data centres in the various regions so watch this space! If you want to see further details of all of these new features, check out the Oracle's "What's New" document here.
If you’re intrigued with the features that Oracle plan to incorporate into the Oracle Analytics platform here is some information on an Oracle Analytics resource worth mentioning; the public roadmap which contains information on Oracle Analytics features that may be included in the platform with an idea of when these may become generally available. A very quick blog post to provide some information about an issue that may arise with Data Visualisation projects based on manual SQL queries in Oracle Analytics Server 5.5 and above. These queries would have worked in previous versions of Oracle Analytics Server. Essentially, manual multi line SQL queries throw an exception: State: HY000. Code: 10058. [NQODBC] [SQL_STATE: HY000] [nQSError: 10058] A Oracle have confirmed that this is a defect that has a workaround. You will only encounter this issue if the SQL query test consists of several lines ending with carriage returns.
The workaround is to place a space character at the end of each line of the query text just before each carriage return. You can find more information about this here.
Photo by Tomas Anton Escobar on Unsplash
Version 5.7.2 of Oracle Analytics Cloud recently started rolling out to Cloud Customers. It comes with a couple of cool features which we'll go through in some detail. A full list of all the features can be found in the 'What's New' section of the Oracle Analytics Cloud documentation.
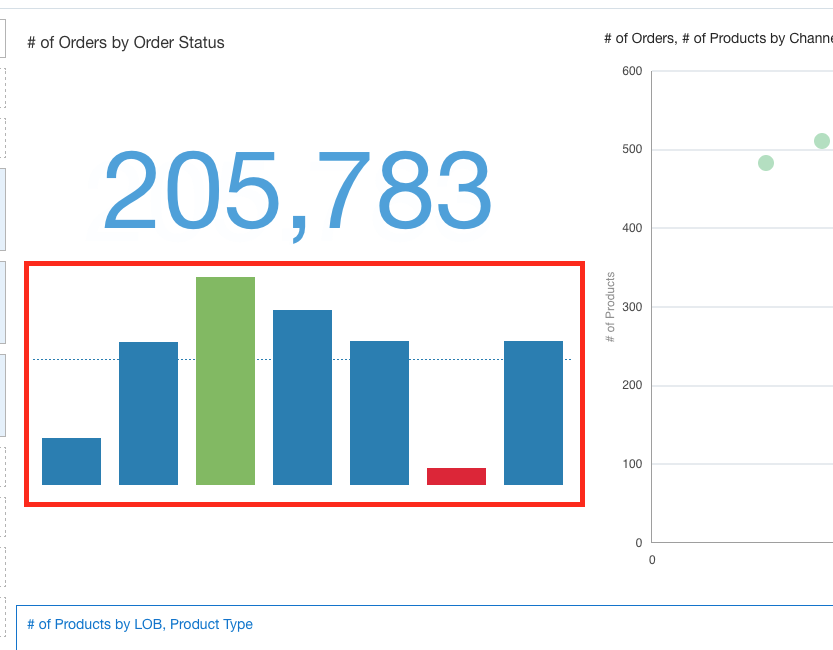
Performance Tile Enhancements There is an update to the Performance Tile visualisation now that allows you to show a breakdown of the measure displayed by a dimensional attribute. There are options to show the dimensional attribute as a line chart, bar chart or as an area chart.
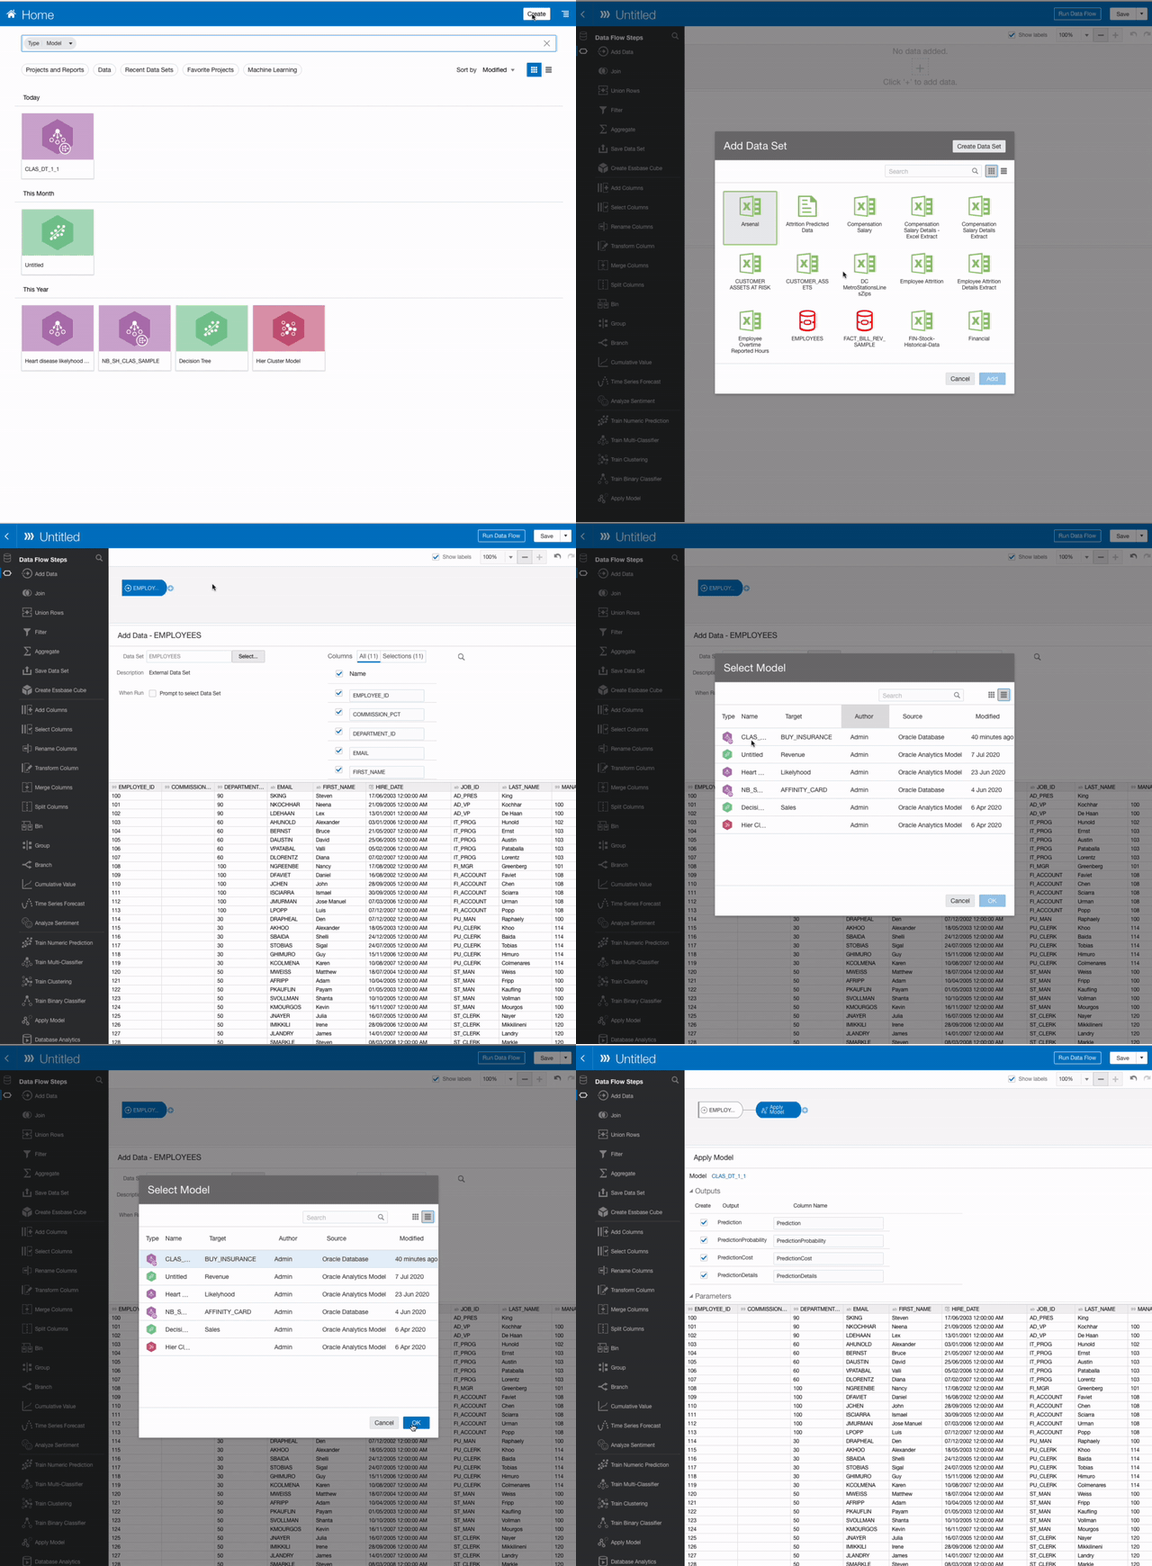
Database OML Models Oracle Analytics Cloud 5.7 now gives users access to register and apply Machine Learning models from an Oracle database (On-Premise or Autonomous Data Warehouse). The main benefit of this feature is that there is no longer any need to physically move data around whilst training and running the model. The other benefit of this approach is that the computing power of the host database of the Machine Learning Model is used when it is executed in Oracle analytics Cloud. 
Once the model has been registered you can look at the properties of the model
Now that the Machine Learning model has been registered, to make use of it in Oracle Analytics Cloud, you create a Data Flow bearing in mind that your data set must be located in the same database as your Machine Learning model (the connection must be the same for the data set and the model).
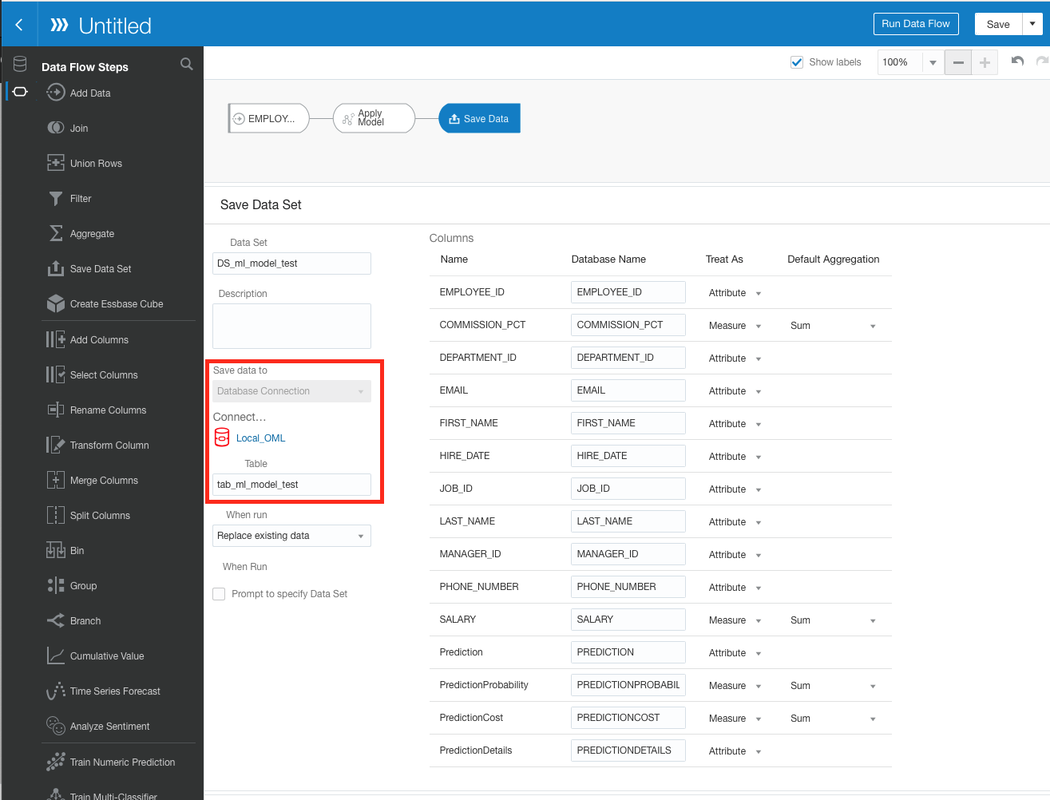
The final step in the Data Flow specifies where the saves the data which is returned from applying the model to the dataset with the predictions which have been calculated.
A table needs to be defined that stores this data in the same database as the Machine Learning model and the data.
List Box Visualisation
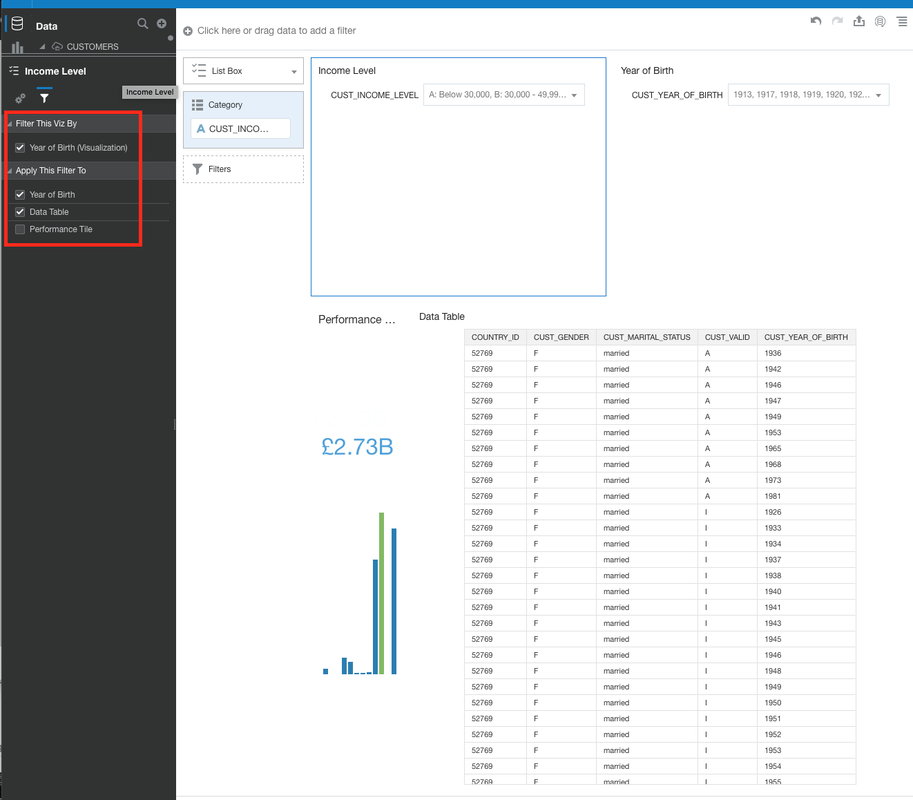
Now this is a feature akin to the OBIEE dashboard prompt although this new visualisation provides a bit more in terms of functionality. You now have the ability to filter visualisations on the canvas at a more granular level. The List Box visualisation filtering can be set to apply to visualisations that you specify. which gives you much more control over how end users can interact with the data on the canvases. There is also the possibility to cascade filtering if you have multiple list box visualisations on a canvas in your project. This means that you can set up the filtering of one to filter on the other based on a selection.
There are some other features that are also included in this release which may be covered in a future blog post.
Photo by Mitchell Hollander on Unsplash
The Oracle Analytics product teams have been working round the clock to put the finishing touches to the latest version of Oracle Analytics Cloud which has just been released. Oracle Analytics Cloud 5.6 comes packed full of new features that aim to make your work of gaining insights into your data that much easier.
In this blog post, we will look at some of the new features that are now available in Oracle Analytics Cloud 5.6.
Maps with custom backgrounds
One feature that could change the way you visually interact with your data is the new method now available which now gives you the ability to use any image in a visualisation as a map layer. You can follow some easy steps to link the custom map layer to your data. Upload an image in the Console > Maps > Image Backgrounds. The next step is to create a Map Layer and in this step you define the shapes (polygons, rectangles or circles) that you want to "map" to your data.
The next step is then to assign the map layer to a column in a Data Set editor (see below).
When you use this column in a visualisation, the default visualisation will be a map visualisation.
Dataset Editor Enhancements
There have been a few changes made to the Oracle Analytics interface that is used to make modifications to Datasets. Some of the changes made to the Dataset Editor include: Columns can now be deleted in the preview screen with a single click.
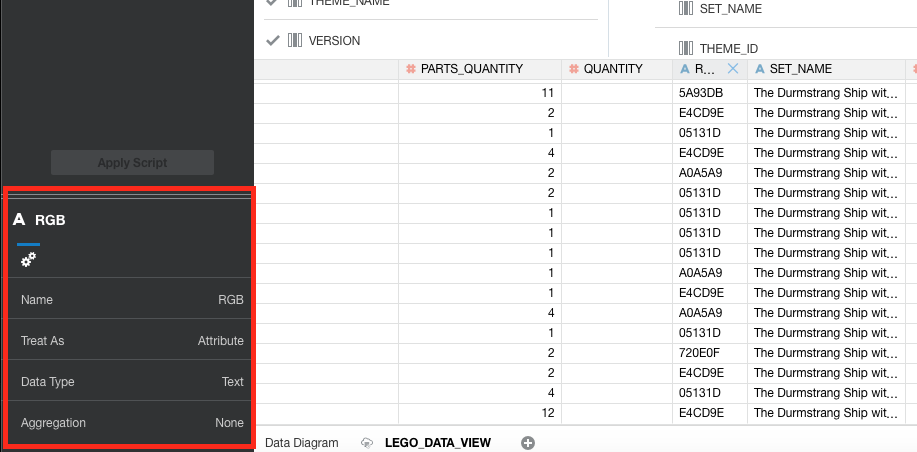
The properties of a column can now be viewed in a properties pane. You select a column from the data preview pane to access the column's properties.
You can apply a filter to your data set within the data set editor.
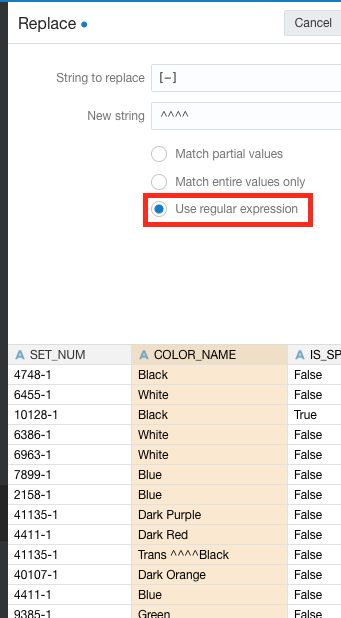
Regular expressions (Regex) can be used to search and replace patterns. This is done via the Replace feature in the dropdown of each column in the data set editor.
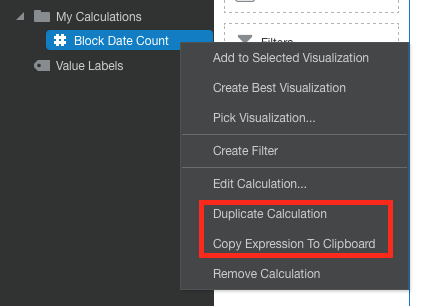
Custom calculations have a new option to duplicate the calculation which is useful in a scenario where you want to create a new calculation similar to one already created rather than having to start completely from scratch.
There is also a ‘Copy Expression to Clipboard’ option now available in the dropdown which I'm still trying to work out a use case for this functionality. Pasting into a text editor shows the expression:
COUNT(XSA('Admin'.'LEGO BRICKS')."Columns"."BLOCK_DATE")
Data Visualisation Enhancements
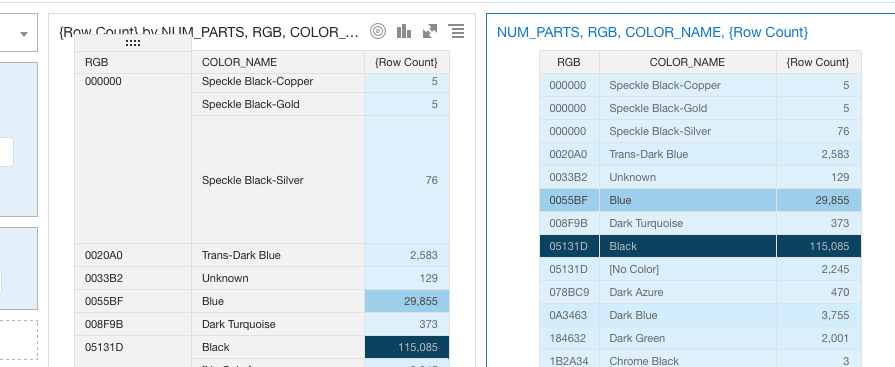
Columns and rows in pivot table and table visualisations can now be resized by dragging on the field left, right, up or down as required. I wasn't able to resize the rows in a table visualisation when I tested out this functionality.
The data preview section has been redesigned to enable more information to be displayed on screen. This has also been implemented in the prepare tab as well.
You can find more information on these enhancements and all other features that are included in the 5.6 release here.
Oracle Analytics Server 5.5.0 was recently released and I've been testing out the OAS installation process. This short blog post just goes through some issues that I encountered during this process related to access to Data Visualisation.
I did an out-of-place upgrade which went remarkably smoothly and imported a BAR file from a 12.2.1.4 OBIEE instance into the new OAS instance. The problem I had was to do with access to Data Visualisation. When I tried to access the Data Visualisation page (server:port/dv/ui), I got an insufficient permissions error:
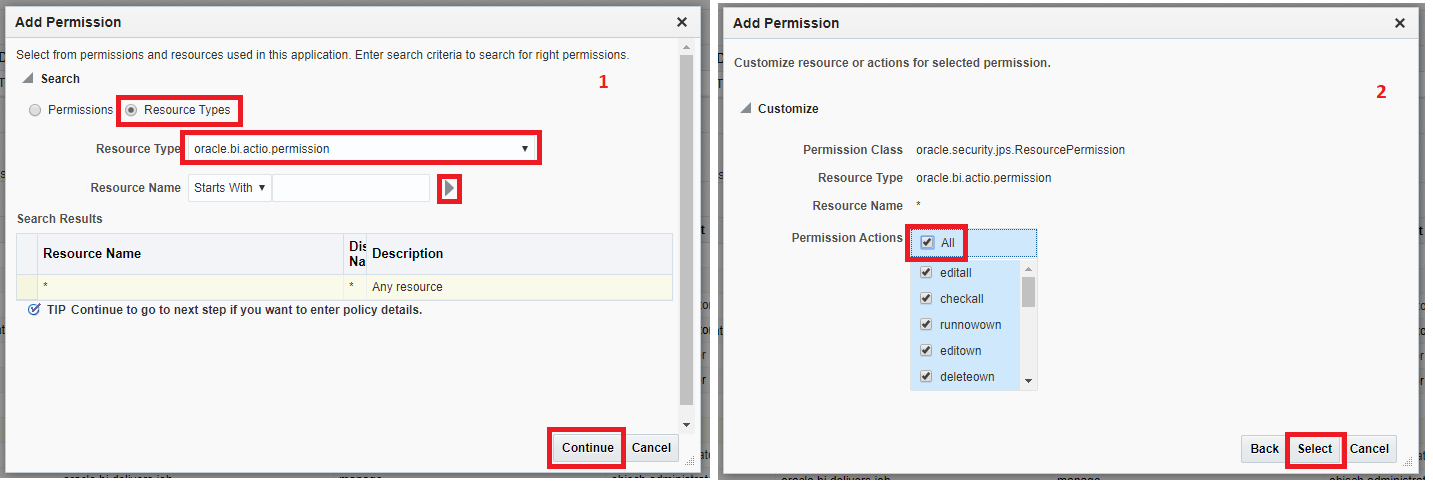
After some digging around, it transpires that there were some WebLogic Application policies that weren't assigned to any Application Roles. Oracle Support pointed me in the direction of this Support Document - Oracle Support Document 2644363.1. The 12.2.1.4 BAR file import wrote over some of the default WebLogic application permissions.The actio.admin permission needs to be granted to the BI Service Administrator application role. This is all done in em (WebLogic Enterprise Manager).
To compartmentalise the Data Visualisation security, I'd highly recommend creating 2 Application Roles:
I was about to publish this blog and the Oracle Support folk just put together a new Support Document based on this issue with overwritten WebLogic application policies after an import of a 12.2.1.4 BAR file into an OAS instance..Hope this saves someone a bit of time.
The Oracle Analytics Product Management team descended on London ahead of the Oracle OpenWorld Europe event for the Oracle Analytics Summit London event held at The Soho Hotel in London on the 11th of February earlier this week.
The day kicked off with a Partner Advisory Council session from the Product Management team which included a look ahead at the roadmap for Oracle Analytics as well as a Q&A session which was very informative. There were several other sessions throughout the day providing participants with a wealth of knowledge on all things Oracle Analytics. Big News...
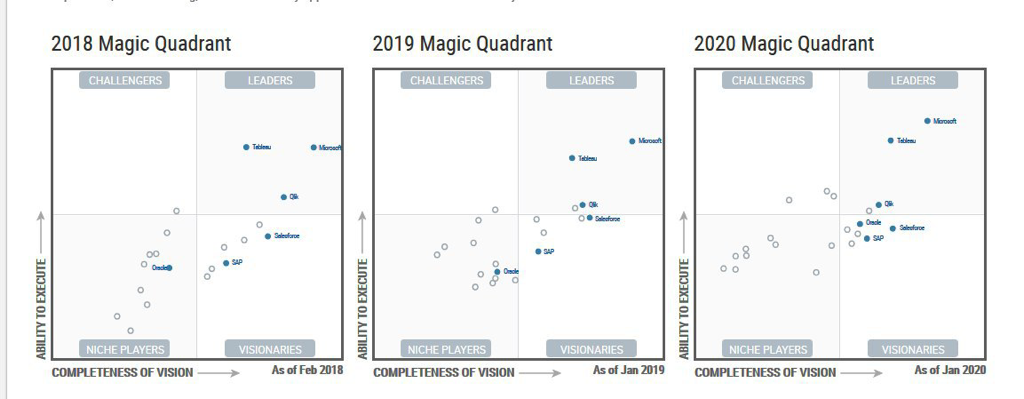
The biggest announcement of the day was undoubtedly Oracle being named a visionary in Gartner's Magic Quadrant for Analytics and BI Platforms. The news was hot off the press and received mixed reactions.
Oracle has had a torrid time in the eyes of the Market Researchers in recent times with the likes of Gartner completely excluding Oracle from the Analytics Magic Quadrant not too long ago. Gartner's justification was regarding the fact that Oracle's Analytics offerings provided little or no self service features which is an opportunity that Oracle missed with the likes of Qlik, Tableau & Power Bi to name but a few that filled the gap in the Self Service Analytics space.
The Oracle Analytics team has filled the Self Service void with a variety of features and products including products and features like Oracle Analytics Desktop, Data Visualisation, Natural Language Processing and all the Augmented capabilities that enable end users to get to their insights with little or no IT intervention. This focus and attention led to Gartner bringing Oracle back into the Magic Quadrant as a niche player.
Oracle has made huge strides in the self service analytics space at the expense of the governed analytics capabilities that hasn't seen much development and enhancements in recent times. The governed analytics part of the Oracle Analytics product is very mature and is its unique selling point. You hear of many stories where end users have acquired a self service analytics tool and plug it into OBIEE's semantic model. Most of the "new age" analytics tools are geared around self service and there still appears to be a huge demand for governed analytics which Oracle Analytics provides alongside its self service capabilities.
Some have said that Oracle may have taken their eye off the ball in order to focus all attention on getting back into Gartner's good books. As mentioned previously, a lot of attention has been focused on self service capabilities possibly to the detriment of governed analytics capabilities.
There was a mix of the Oracle Analytics Product Management team, Partners and Customers in attendance at the Oracle Analytics Summit and it was great to see and hear first hand from the Product Management team.
After a very long wait, the successor of OBIEE is here. Oracle Analytics Server was made generally available on Friday the 31st of January.
At the Oracle Analytics Summit held last summer, Oracle Analytics Server was announced as part of the wider rationalisation of the Oracle Analytics product line.
Oracle Analytics Cloud (OAC) as its name suggests is Oracle’s cloud offering of an Analytics product. Oracle has focused heavily on developing and enhancing OAC and OBIEE has not seen as much development in the same period. OAC has gathered momentum in the self service analytics space as well as opening up the augmented analytics space. It also retained OBIEE’s governed analytics functionality which is in many people’s opinion, the unique selling point of Oracle’s analytics offering. To bridge the gap between OAC and OBIEE, Oracle came up with the great idea of the Oracle Analytics Server product, OAS. Most of the OAC functionality is available in OAS and what makes this a very appealing prospect is the fact that OBIEE licensed users can upgrade to OAS for free. How do I get it?
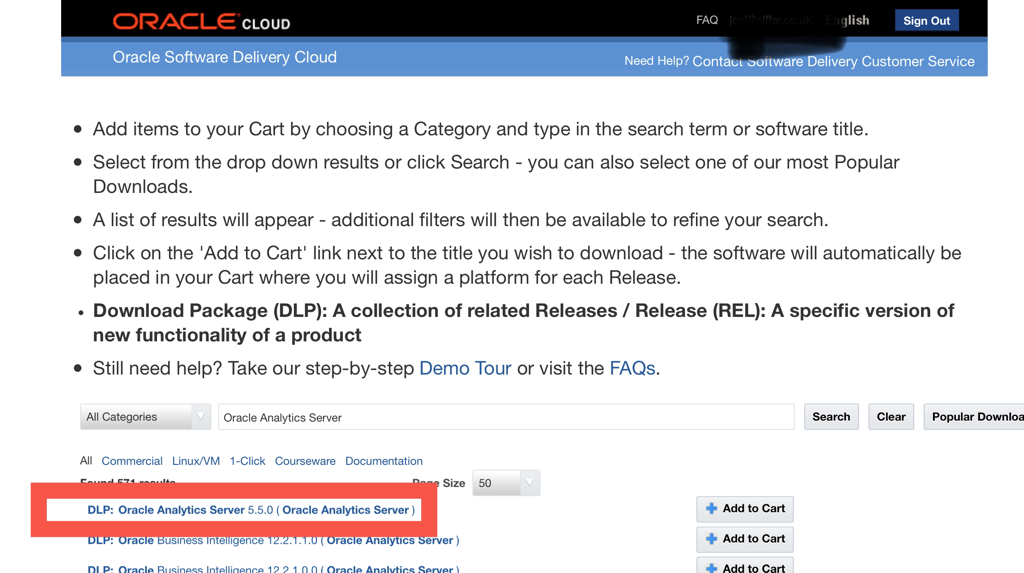
A very good question! Currently, OAS 5.5.0 is available from eDelivery - just search for “Oracle Analytics Server “.
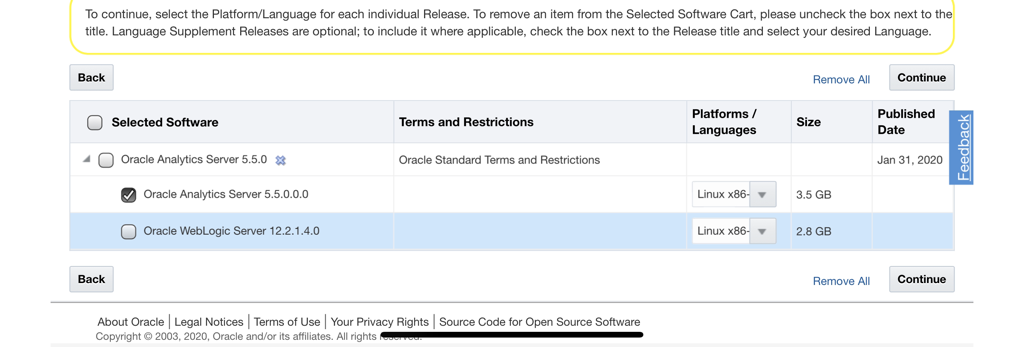
You’ll notice that 5.5 is only available on the Linux operating system with a Windows variant to follow later on. Gianni Ceresa has written an excellent post on OAS and he has made a discovery of a slight issue with the version of the Fusion Middleware Infrastructure that is bundled with OAS on eDelivery.
Your best bet is to get a version of 12.2.1.4 Fusion Middleware Infrastructure from here.
There is an Oracle document with detailed steps of the installation which will come as no surprise to those who’ve done OBIEE 12c installations and upgrades. Make sure that you’re JDK version is at least 1.8.0_221 and you’ll be good to go. Upgrades
Currently, the only way that you can do upgrades from 12c to OAS is as an out-of-place upgrade. In-place upgrades will be available in future OAS releases.
Once you’ve completed the installation and configuration, you can use the BAR (BI Archive) file technique to migrate your 12c content over to your new OAS instance. Alternatively, you could do this via the snapshot feature available via the Oracle Analytics console. Addendum
Not all of the OAC features are available in OAS and some of these include the Natural Language Generation augmented analytics feature.
Some OBIEE features within OAS have been disabled by default as there are plans to deprecate these features. This Oracle Support document provides a list of these features and also provides some information on how to enable these deprecated features. Some of the OBIEE features to be deprecated in OAS include:
The Baseline Validation Tool (BVT) is not currently supported with Oracle Analytics Server.
|
AuthorA bit about me. I am an Oracle ACE Pro, Oracle Cloud Infrastructure 2023 Enterprise Analytics Professional, Oracle Cloud Fusion Analytics Warehouse 2023 Certified Implementation Professional, Oracle Cloud Platform Enterprise Analytics 2022 Certified Professional, Oracle Cloud Platform Enterprise Analytics 2019 Certified Associate and a certified OBIEE 11g implementation specialist. Archives
May 2024
Categories |
||||||||||||























 RSS Feed

