|
The Oracle Analytics REST API Connector is now available in the September 2022 Oracle Analytics update in preview mode. The connector now allows access to data directly from REST API endpoints. To access the REST API Connector, you will need to enable the feature in the Console System Settings preview section by switching on the toggle. 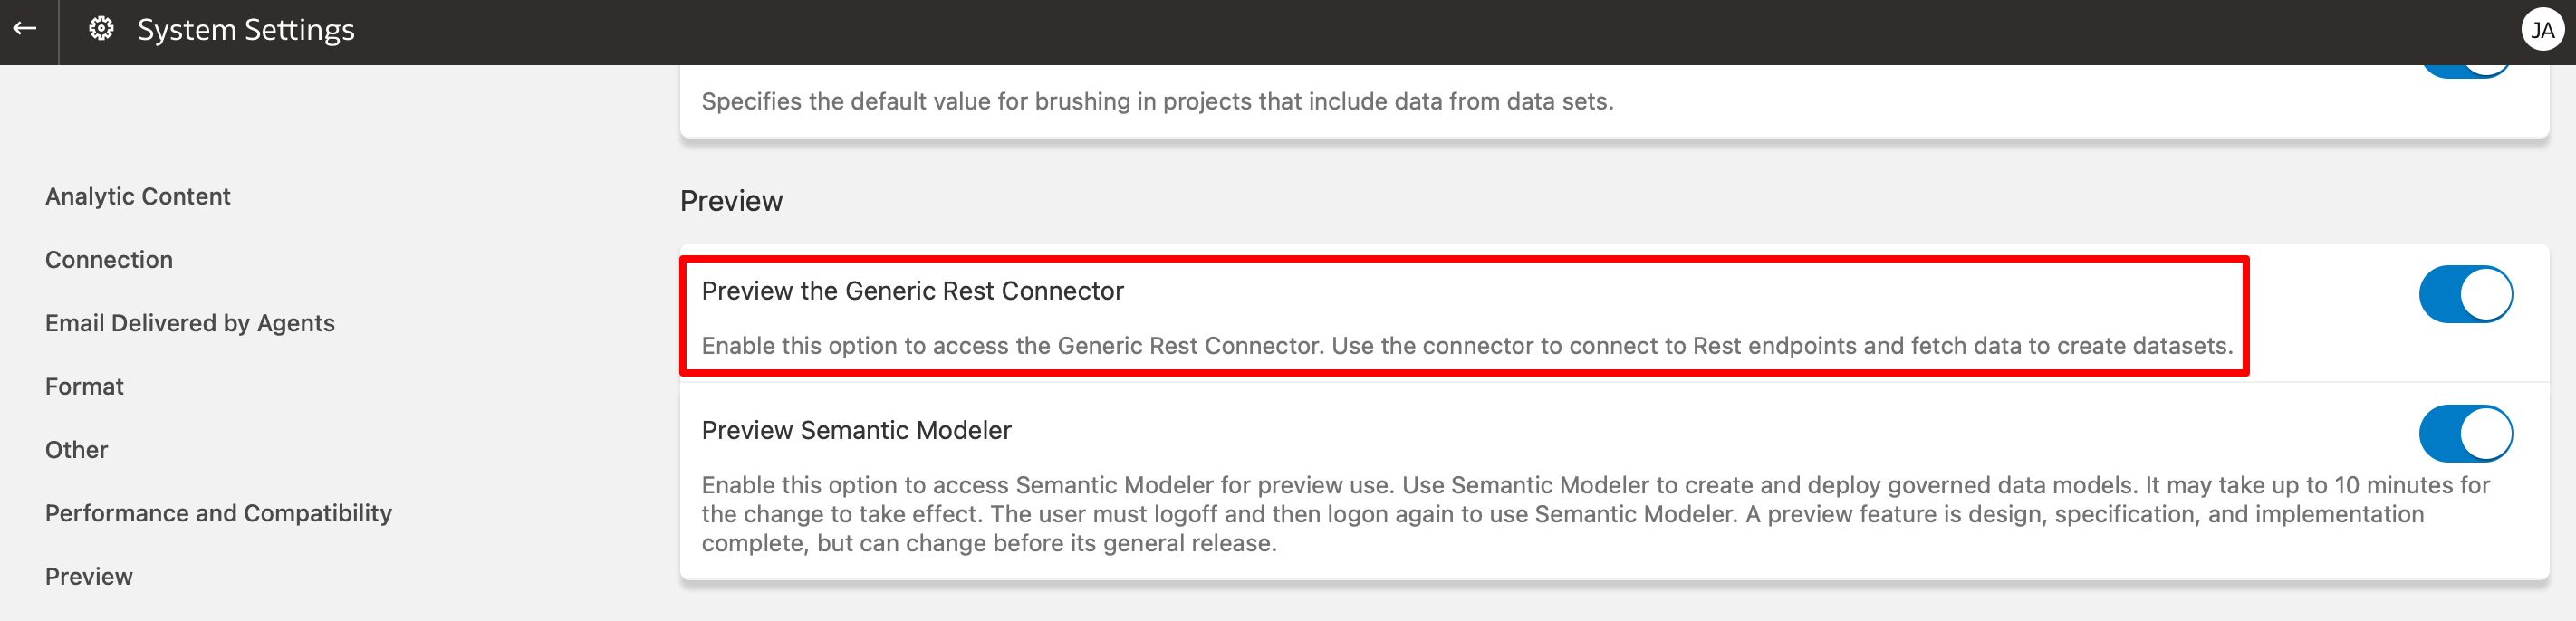 You will need to log off and back on again to apply the change to your instance. You should now see the REST API connector in the create > connections menu on the Oracle Analytics homepage. 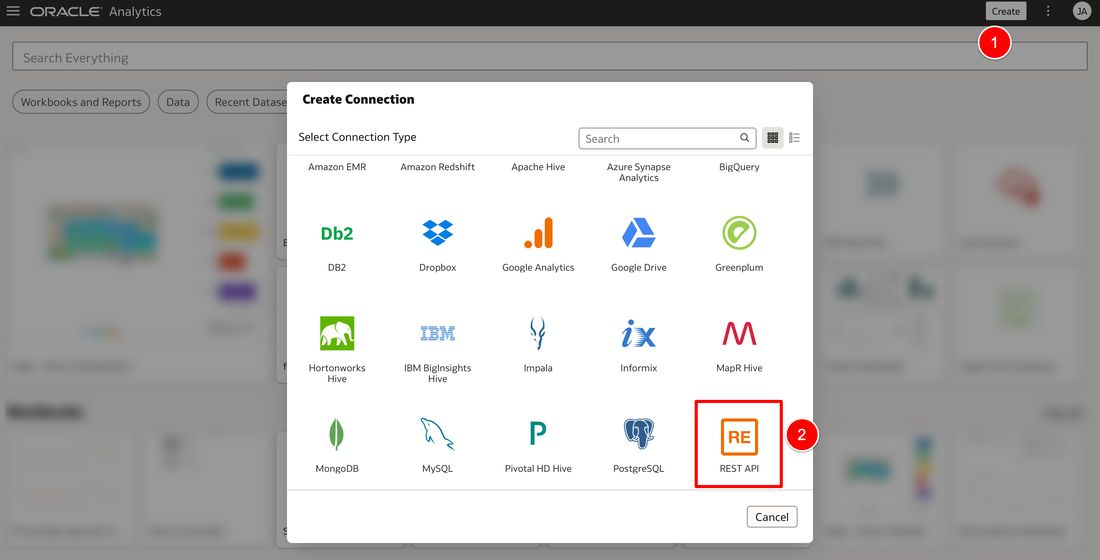 In the next screen, you enter details of your REST API that you want to access. The basic information required for connecting are:
You can either enter the information in here directly or you can use a JSON template to enter all of the REST API information. A sample JSON template file can be found at the bottom of this post. 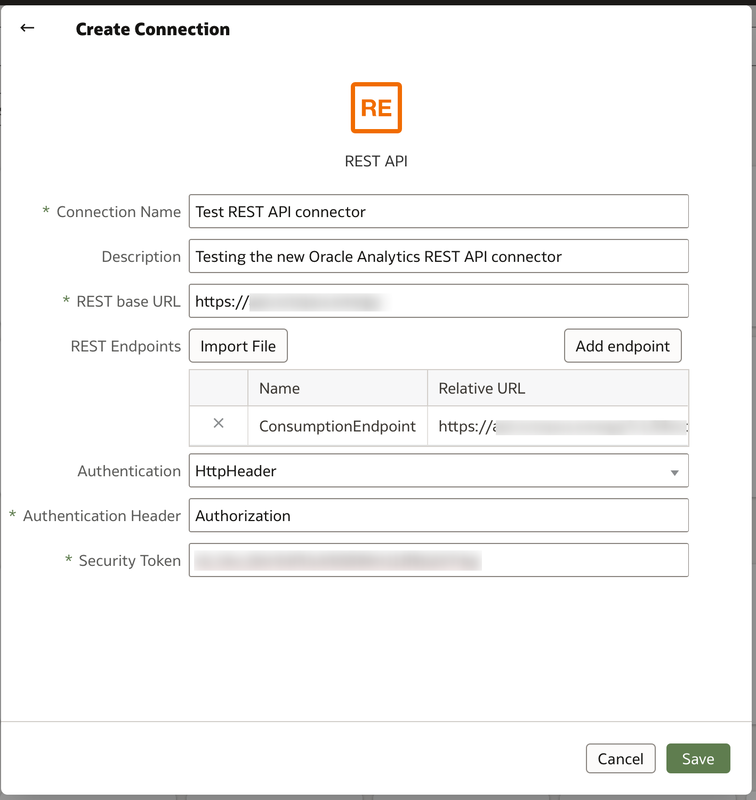 If you decide to enter information of the REST API for your connector using a JSON file, you will need the contents to match the syntax below. If your API has several endpoints that you will be using then enter each endpoint URL in the endpoints section. Ensure that the correct authentication type is entered. Once all completed, the connection can be used as a standard connection to create a dataset. . During the testing of this new functionality, the REST API used BasicAuth authentication and the API key was supposed to be entered in the username field. The issue here is that the password is a mandatory field and can't be left blank. The way round this was to re-enter the API key in the password field as well. 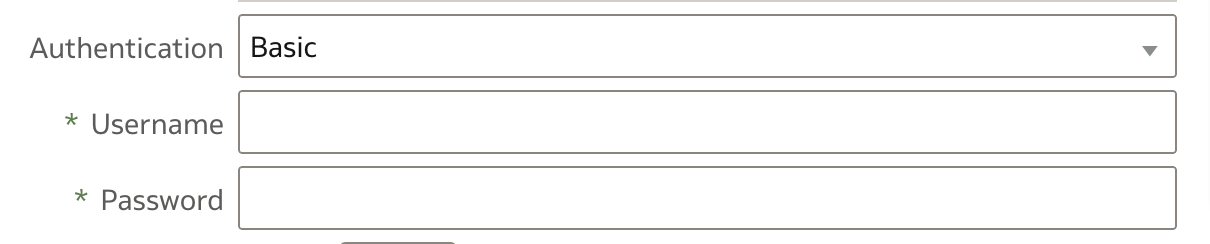 Once the connection has been created, you can create a dataset using the REST API connection in the normal fashion. 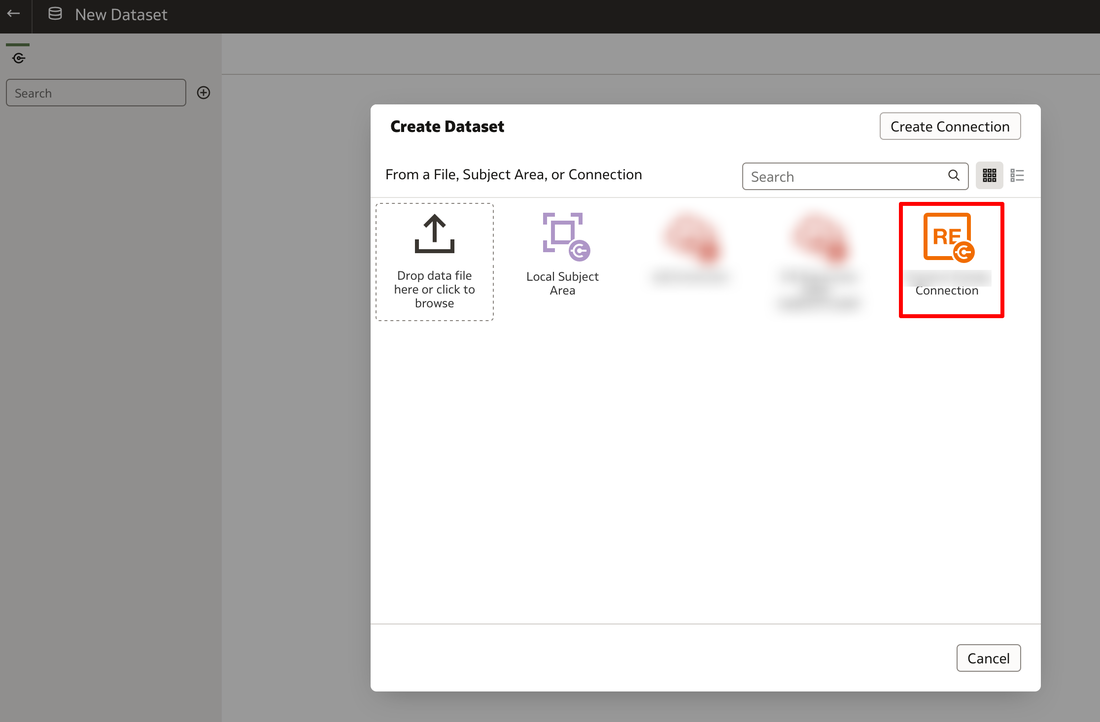 In the connection panel of the New Dataset window expand the REST API connection to the AUTOREST schema to access the result sets of the endpoints. The RESULTS tables contain the data from the endpoints and the others contain metadata of the endpoints. 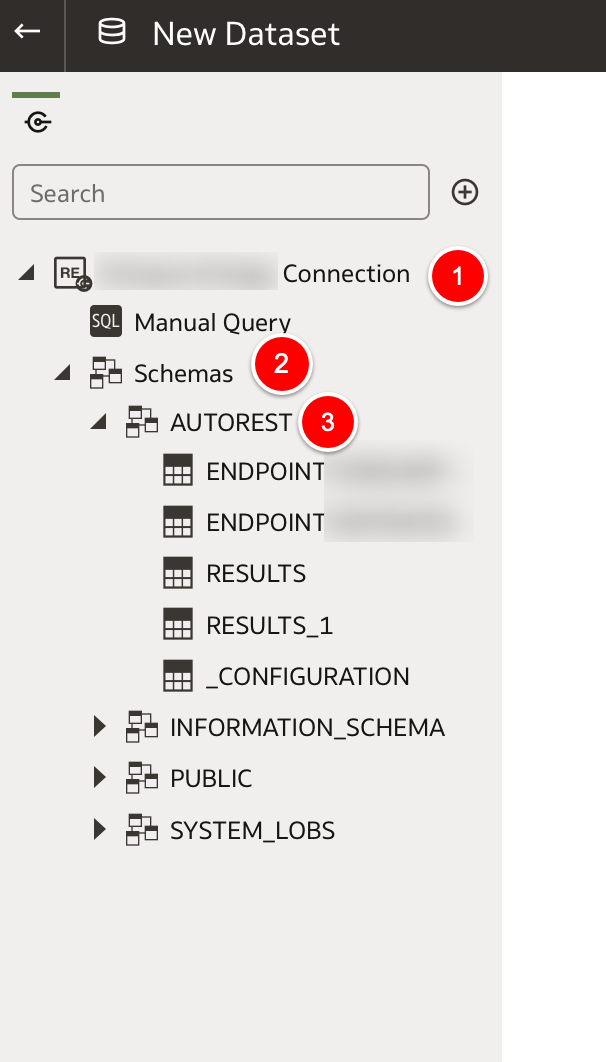 The new REST API connector is a great addition to the Oracle Analytics capability. It now gives users another means of bringing additional data in to uncover even more insights from your enterprise data assets.
0 Comments

Photo by Isaac Smith on Unsplash
The Oracle Analytics team have been busy working on the latest version of Oracle Analytics Cloud - 5.9 which is packed with a number of interesting features and enhancements that we'll cover in some detail in this blog post.
Real Estate
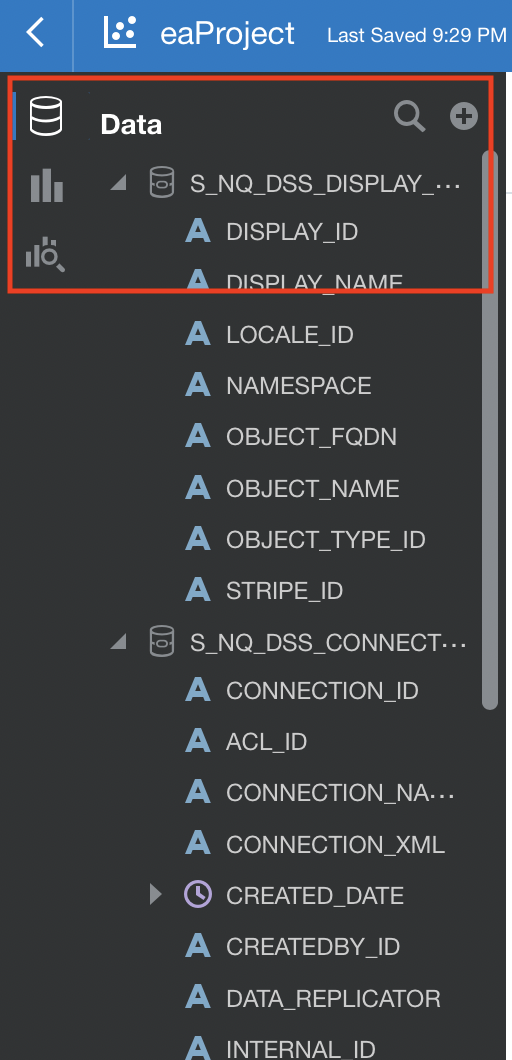
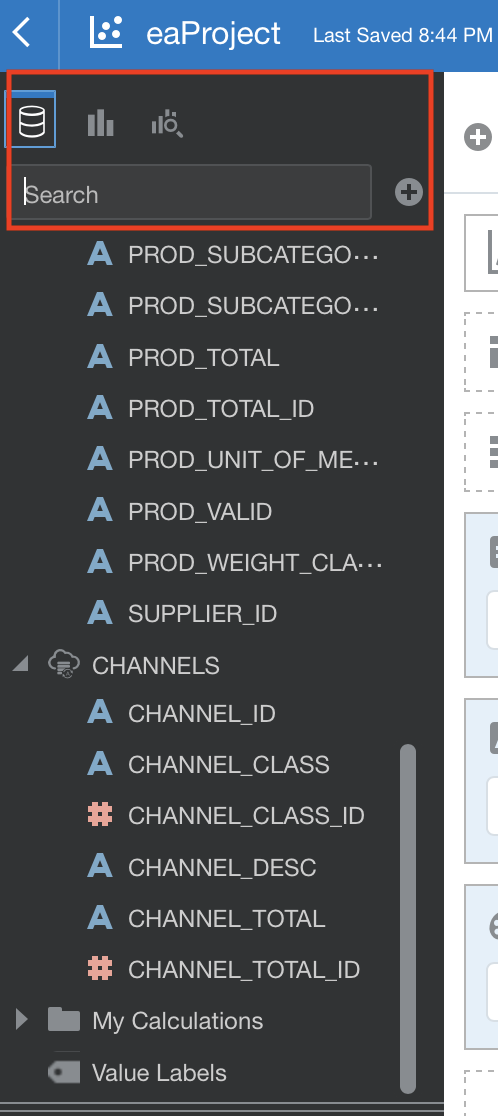
There is now a permanent Search field and smaller Data, Visualisations and Analytics icons which have been relocated to the top of the side bar. This results in the reduction of wasted space on the left of the side bar.
Progress Bars
The animated progress bars that are displayed when visualisations and data are loaded have been updated.
The thin blue horizontal progress bars that were visible in previous Oracle Analytics versions across the screen when a. visualisation or canvas was refreshed have been changed as you can see in the images above.
Data Preparation
TRIM Function
There is now one click access to TRIM whitespace from a text column in the Data Preparation stage of Data Visualisation. This removes whitespace from both sides of the selected column 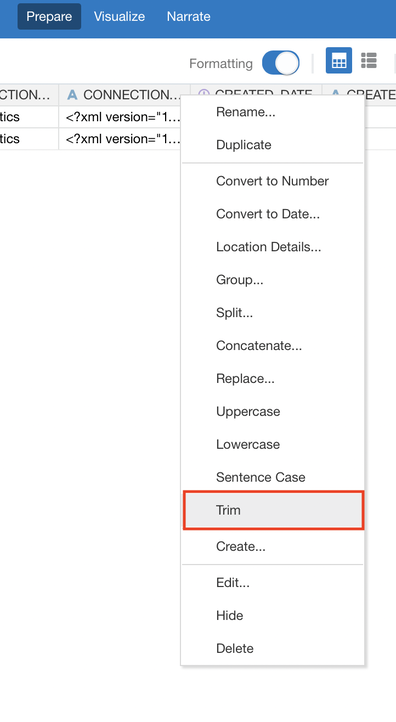
US ZIP Codes
This new feature is available in a column that contains ZIP code data. Oracle Analytics suggests a recommendation step to repair any of the ZIP codes that have missing leading zeros. 
Filter Enhancements
You can now move a Visualisation level filter to the Canvas level by simply dragging it from the side bar to the Canvas level filter section. You can also do the opposite; moving a filter from the Canvas level to a specific Visualisation. 
Sorting Enhancements
There is now the capability in OAC 5.9 to sort by multiple dimensional attributes. In the screenshot below, you can see that the state_name and county_name have sorts defined. Columns added to the Size and Tooltip of a visualisation can also be included in the visualisation sorting. 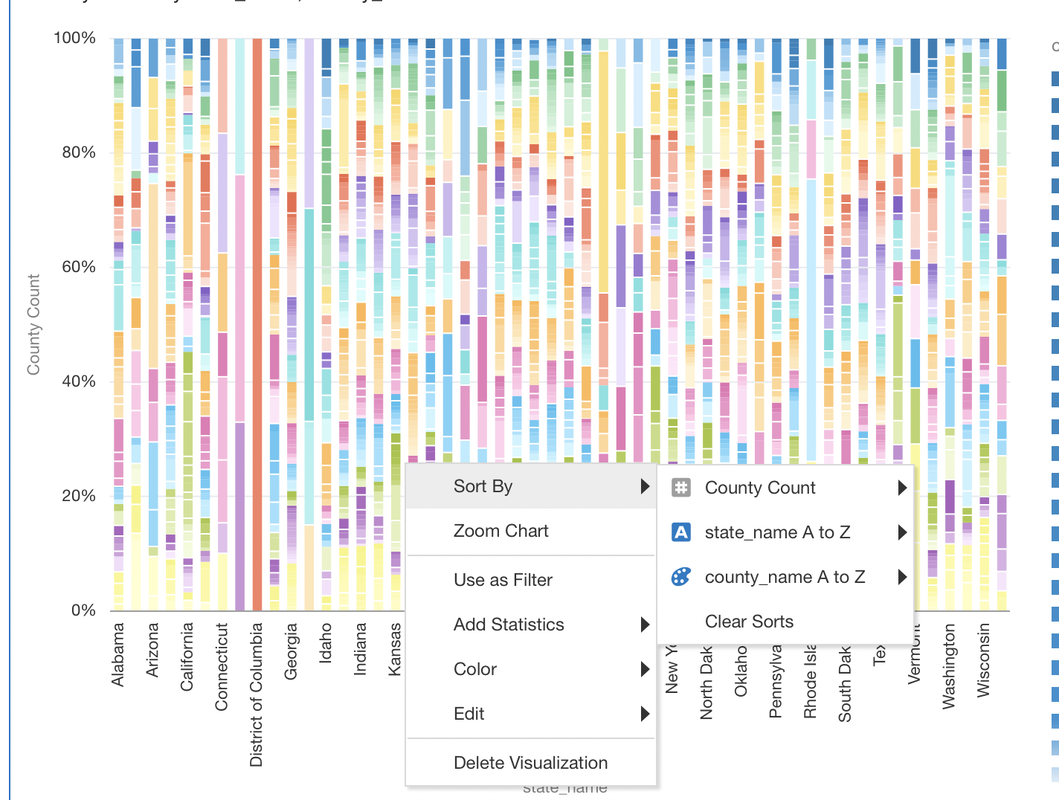
You can also sort by a measure but note that this will overwrite any dimensional attribute sorting that has been previously defined for the visualisation.
Export Limits For those who still export data dumps to Excel ?, row limits have been increased. Formatted exports that include XLSX, PPTX, HTML and PDF files have been increased to 400,000 rows with instances that have 16-52 OCPUs. Instances with 2-12 OCPUs will have their limit increased to 200,000 rows. The limits of unformatted report exports (XML, Tab Delimited and CSV) have been increased to 2,000,000 rows for instances with 2-12 OCPUs. Instances with 16-52 OCPUs will see their limits rise to 4,000,000 rows. Area Visualisation Enhancements
There were previously 2 Area Visualisations in versions of Oracle Analytics prior to version 5.9. There are now 3 types; Area, Stacked Area and 100% Area.
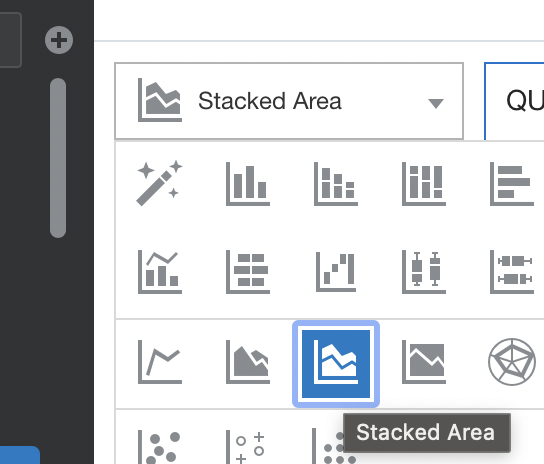
I personally think that the new Stacked Area visualisation is more "visual" and users can gain a quicker insight visually.
New Mapping Options
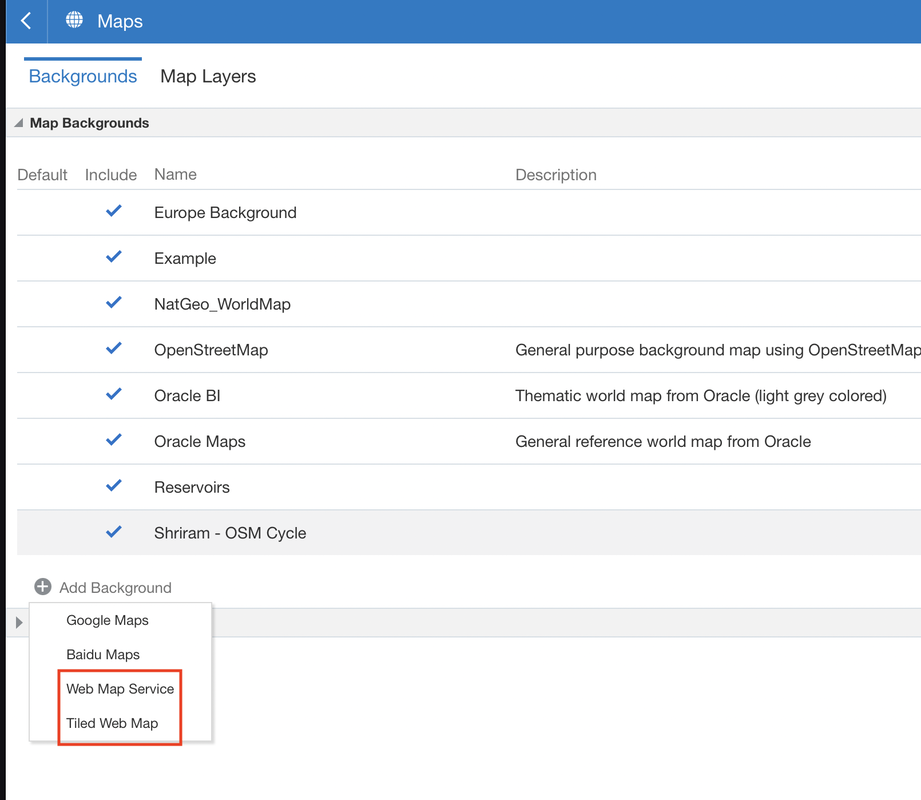
These new map backgrounds give users more flexibility with their map visualisations.
Machine Learning
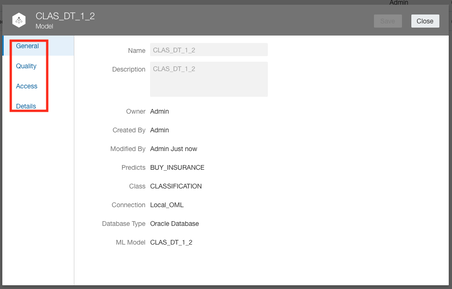
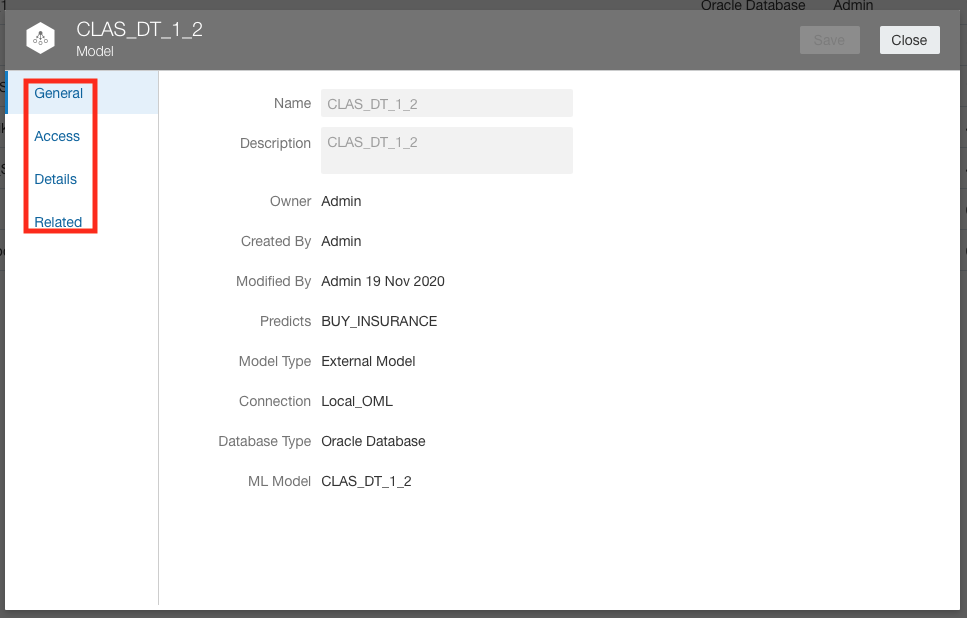
It can be useful to gain some insights into the Machine Learning models that Oracle Analytics uses. There have been some enhancements added to the Oracle Machine Learning (OML) inspect tab which exposes much more metadata about the Machine Learning model.
There has been some renaming and reorganising of the tabs available in the Machine Learning Inspect window. The Details tab contains basic information about the Oracle Machine Learning model including input and output columns.
The Related tab now shows in-depth information of the Oracle Machine Learning model which is stored in database metadata views.
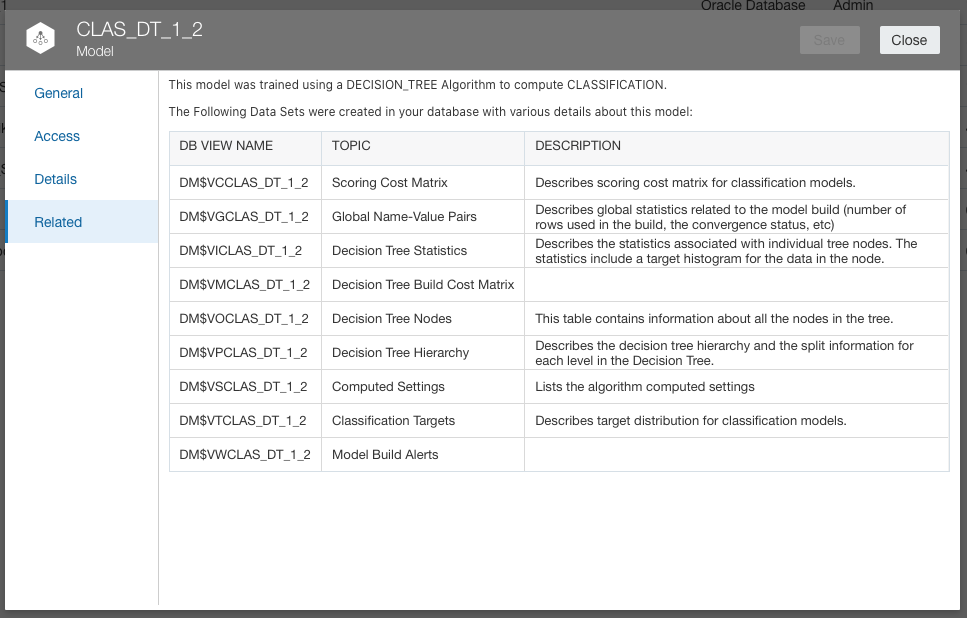
You can even access these views and build out visualisations to gain further insights and understanding of the Machine Learning models that you are using in your Analytics.
The Oracle Analytics team have put together a YouTube video about it which you can view below. Text Tokenization
In previous versions of Oracle Analytics, Text Tokenization was indirectly available. OML ADW capabilities could be used. Francesco Tisiot recently blogged about this with a good example demonstrating a typical use case for textual analytics.
In Oracle Analytics Cloud 5.9, Text Tokenization is natively available as a data flow step thereby taking away the need to access the ADW instance in order to create a context index on the text column to be analysed and then to link the tokens to the text field in your data that is being analysed. This is now done for you automatically.
The Text Tokenization functionality only works with Oracle sourced datasets - ATP, ADW and Oracle On-Premise Databases. It makes use of the Oracle Text database functionality and the Database Analytics data flow step is only available for these Oracle sourced datasets. In order to avoid this error: 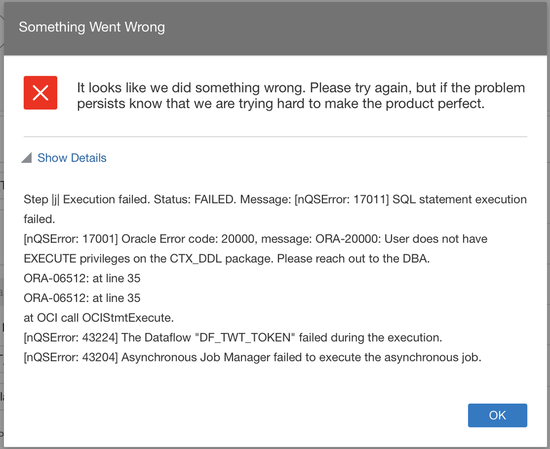
Ensure that your user account that you use for the connection to the database has the correct privileges:
Conclusion
As you will have gathered, this 5.9 release of Oracle Analytics Cloud comes packed with a wide range of features and enhancements. The release is typically staggered whilst the upgrade is applied to the Oracle data centres in the various regions so watch this space! If you want to see further details of all of these new features, check out the Oracle's "What's New" document here.
If you’re intrigued with the features that Oracle plan to incorporate into the Oracle Analytics platform here is some information on an Oracle Analytics resource worth mentioning; the public roadmap which contains information on Oracle Analytics features that may be included in the platform with an idea of when these may become generally available. 
The Oracle Analytics Product Management team descended on London ahead of the Oracle OpenWorld Europe event for the Oracle Analytics Summit London event held at The Soho Hotel in London on the 11th of February earlier this week.
The day kicked off with a Partner Advisory Council session from the Product Management team which included a look ahead at the roadmap for Oracle Analytics as well as a Q&A session which was very informative. There were several other sessions throughout the day providing participants with a wealth of knowledge on all things Oracle Analytics. Big News...
The biggest announcement of the day was undoubtedly Oracle being named a visionary in Gartner's Magic Quadrant for Analytics and BI Platforms. The news was hot off the press and received mixed reactions.
Oracle has had a torrid time in the eyes of the Market Researchers in recent times with the likes of Gartner completely excluding Oracle from the Analytics Magic Quadrant not too long ago. Gartner's justification was regarding the fact that Oracle's Analytics offerings provided little or no self service features which is an opportunity that Oracle missed with the likes of Qlik, Tableau & Power Bi to name but a few that filled the gap in the Self Service Analytics space.
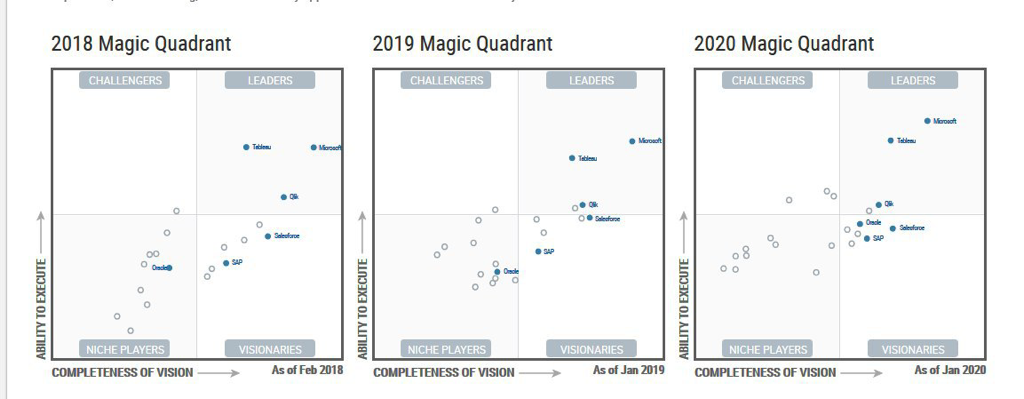
Oracle's progression over the years.
The Oracle Analytics team has filled the Self Service void with a variety of features and products including products and features like Oracle Analytics Desktop, Data Visualisation, Natural Language Processing and all the Augmented capabilities that enable end users to get to their insights with little or no IT intervention. This focus and attention led to Gartner bringing Oracle back into the Magic Quadrant as a niche player.
Oracle has made huge strides in the self service analytics space at the expense of the governed analytics capabilities that hasn't seen much development and enhancements in recent times. The governed analytics part of the Oracle Analytics product is very mature and is its unique selling point. You hear of many stories where end users have acquired a self service analytics tool and plug it into OBIEE's semantic model. Most of the "new age" analytics tools are geared around self service and there still appears to be a huge demand for governed analytics which Oracle Analytics provides alongside its self service capabilities.
Some have said that Oracle may have taken their eye off the ball in order to focus all attention on getting back into Gartner's good books. As mentioned previously, a lot of attention has been focused on self service capabilities possibly to the detriment of governed analytics capabilities.
There was a mix of the Oracle Analytics Product Management team, Partners and Customers in attendance at the Oracle Analytics Summit and it was great to see and hear first hand from the Product Management team. The purpose of this blog post is to highlight the results of a number of Research Analysts reports that have been recently published on Analytics platforms and how Oracle Analytics Cloud measured up with other vendors. 451 Research In the findings of 451 Research, it is claimed that “the sleeping giant has awakened “.451 Research notes that Oracle Analytics Cloud is the second largest part of Oracle’s PaaS business which is a bold statement if true. Machine Learning and Artificial Inteligence features that have been incorporated into the Data Preparation functionality of the Data Visualisation tool got a mention.  G2 Crowd Oracle Analytics Cloud platform was categorised in the Leaders quadrant according to G2 Crowd’s research. G2 Crowd collates its results from reviews from hands on users of these tools. 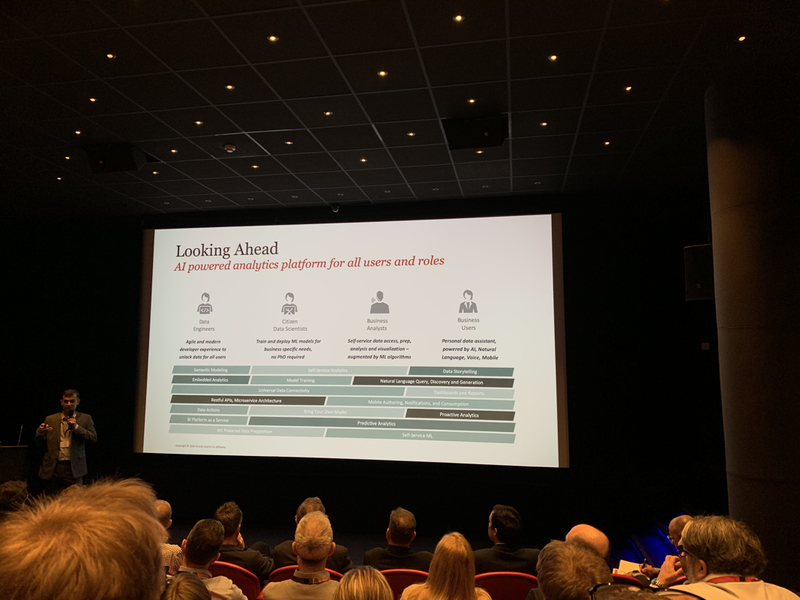 Gartner In Gartner’s 2019 Magic Quadrant for Analytics and Business Intelligence platforms, Oracle has made a re-entry after a brief absence in 2016 for being too IT centric and being late to the bimodal Analytics party. Oracle made it back in as a Niche player by addressing this issue by expanding the functionality of the Data Visualisation tool giving end users the ability to mashup data from the IT managed semantic model with spreadsheets for instance. Gartner has recently mentioned a term, “Augmented Analytics” several times and it appears that Oracle has made huge strides in this direction by implementing such things as Data Preparation, Machine Learning and Natural Language generation which are all in line with Gartner’s Augmented Analytics. 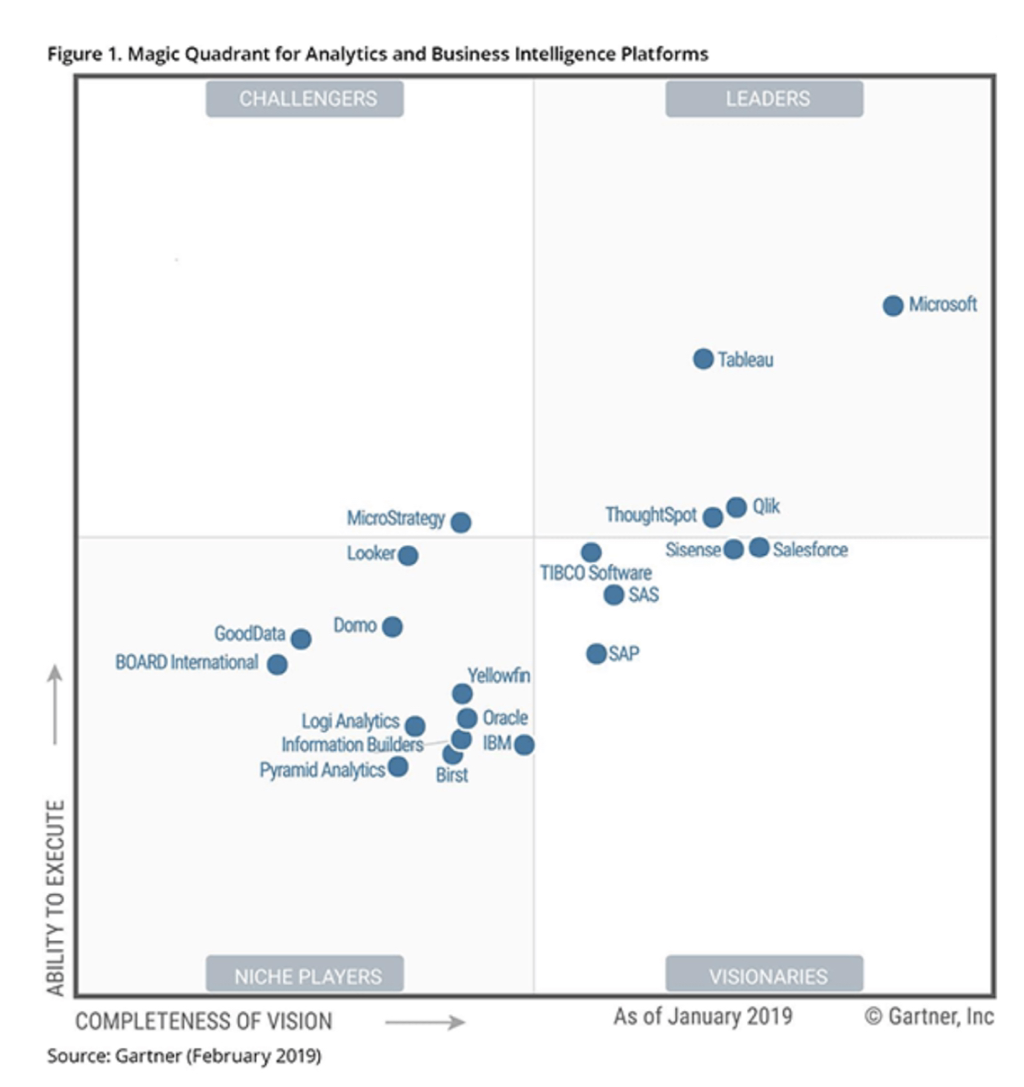 Conclusion
You may have noticed the varied opinions of these Research results and I must admit that a lot of great work goes in to creating these reports but there is also a huge amount of subjectivity that is involved in the process. These reports are useful but shouldn't be used in isolation when you may be on the market for Analytics tools. It should form part of the process. |
AuthorA bit about me. I am an Oracle ACE Pro, Oracle Cloud Infrastructure 2023 Enterprise Analytics Professional, Oracle Cloud Fusion Analytics Warehouse 2023 Certified Implementation Professional, Oracle Cloud Platform Enterprise Analytics 2022 Certified Professional, Oracle Cloud Platform Enterprise Analytics 2019 Certified Associate and a certified OBIEE 11g implementation specialist. Archives
May 2024
Categories
|
||||||||||||||||


 RSS Feed
