|
Photo by Mitchell Hollander on Unsplash
The Oracle Analytics product teams have been working round the clock to put the finishing touches to the latest version of Oracle Analytics Cloud which has just been released. Oracle Analytics Cloud 5.6 comes packed full of new features that aim to make your work of gaining insights into your data that much easier.
In this blog post, we will look at some of the new features that are now available in Oracle Analytics Cloud 5.6.
Maps with custom backgrounds
One feature that could change the way you visually interact with your data is the new method now available which now gives you the ability to use any image in a visualisation as a map layer. You can follow some easy steps to link the custom map layer to your data. Upload an image in the Console > Maps > Image Backgrounds. The next step is to create a Map Layer and in this step you define the shapes (polygons, rectangles or circles) that you want to "map" to your data.
The next step is then to assign the map layer to a column in a Data Set editor (see below).
When you use this column in a visualisation, the default visualisation will be a map visualisation.
Dataset Editor Enhancements
There have been a few changes made to the Oracle Analytics interface that is used to make modifications to Datasets. Some of the changes made to the Dataset Editor include: Columns can now be deleted in the preview screen with a single click.
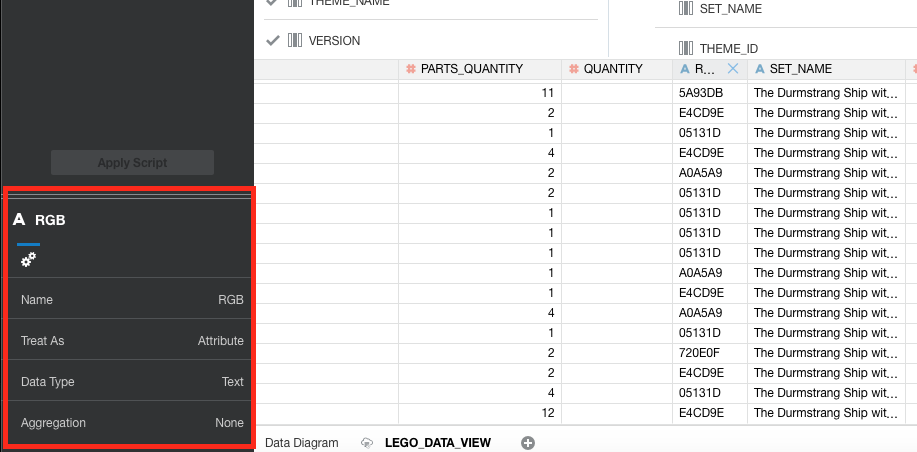
The properties of a column can now be viewed in a properties pane. You select a column from the data preview pane to access the column's properties.
You can apply a filter to your data set within the data set editor.
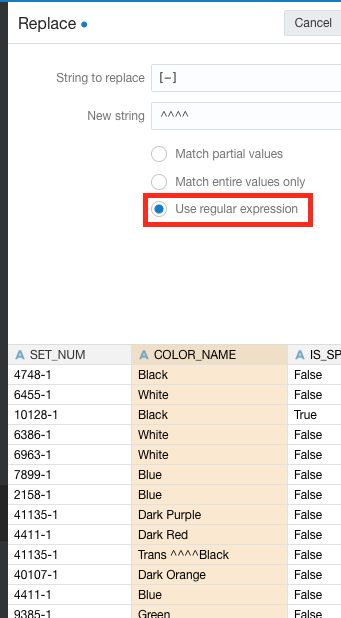
Regular expressions (Regex) can be used to search and replace patterns. This is done via the Replace feature in the dropdown of each column in the data set editor.
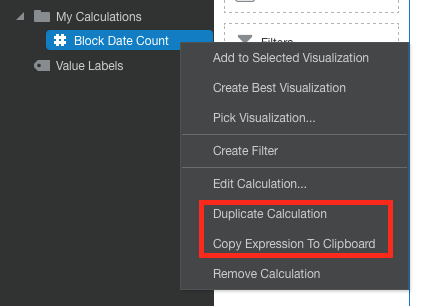
Custom calculations have a new option to duplicate the calculation which is useful in a scenario where you want to create a new calculation similar to one already created rather than having to start completely from scratch.
There is also a ‘Copy Expression to Clipboard’ option now available in the dropdown which I'm still trying to work out a use case for this functionality. Pasting into a text editor shows the expression:
COUNT(XSA('Admin'.'LEGO BRICKS')."Columns"."BLOCK_DATE")
Data Visualisation Enhancements
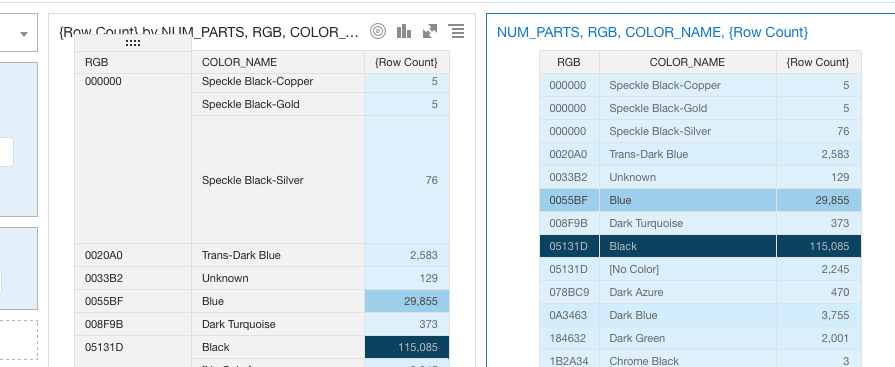
Columns and rows in pivot table and table visualisations can now be resized by dragging on the field left, right, up or down as required. I wasn't able to resize the rows in a table visualisation when I tested out this functionality.
The data preview section has been redesigned to enable more information to be displayed on screen. This has also been implemented in the prepare tab as well.
You can find more information on these enhancements and all other features that are included in the 5.6 release here.
0 Comments
|
AuthorA bit about me. I am an Oracle ACE Pro, Oracle Cloud Infrastructure 2023 Enterprise Analytics Professional, Oracle Cloud Fusion Analytics Warehouse 2023 Certified Implementation Professional, Oracle Cloud Platform Enterprise Analytics 2022 Certified Professional, Oracle Cloud Platform Enterprise Analytics 2019 Certified Associate and a certified OBIEE 11g implementation specialist. Archives
May 2024
Categories |


 RSS Feed

