OAC
Finally, Gantt Charts Arrive in Oracle Analytics Cloud!
For as long as I can remember, Oracle Analytics users have been asking for one simple but powerful capability: a native Gantt chart.Something to track timelines, visualise dependencies, and monitor progress - all within…

For as long as I can remember, Oracle Analytics users have been asking for one simple but powerful capability: a native Gantt chart.
Something to track timelines, visualise dependencies, and monitor progress - all within the same dashboards where KPIs and trends already live.
With the November 2025 update, Oracle Analytics Cloud (OAC) finally delivers.
It’s a long-requested feature that transforms how we visualise projects, portfolios, and operational workflows.
The Wait Is Over
Until now, anyone wanting to visualise schedules inside OAC had to get creative — using bar charts to simulate timelines, or embedding third-party components. It worked, but it was clunky.
The new Gantt Chart visualisation makes this native and intuitive.
It allows analysts and project teams to show project timelines, milestones, and progress bars directly inside their OAC workbooks, fully integrated with data security, filters, and visual interactions.
This isn’t just a pretty new chart. It’s a meaningful step toward operational analytics, where OAC becomes a live window into how work is progressing, not just how metrics are trending.
What’s New in the November 2025 Update
The Gantt Chart visual introduces a new way to represent time-based activities. Here’s what it currently supports:
- Task timelines: Start and end dates rendered as horizontal bars.
- Progress tracking: Percentage complete shown visually within each bar.
- Milestones: Zero-duration tasks represented as markers.
- Grouping: Organise tasks by project, phase, or resource type.
- Baselines: Display baseline start and end dates alongside actuals for schedule comparison.
- Dependencies: Align related tasks sequentially using shared attributes.
- Tooltips: Show contextual details such as owner, status, priority, or duration.
For many teams, PMOs, delivery leads, or operations managers, this fills a long-standing visualisation gap in OAC. The new Gantt visualisation transforms Oracle Analytics Cloud into a capable project-tracking tool. It bridges the gap between analytics and project management, enabling users to track, analyse, and present progress all in one platform.
Try It Yourself – Sample Data
To test the new Gantt, I’ve created a realistic dataset that you can import directly into OAC.
Download oac_gantt_test_data.csv
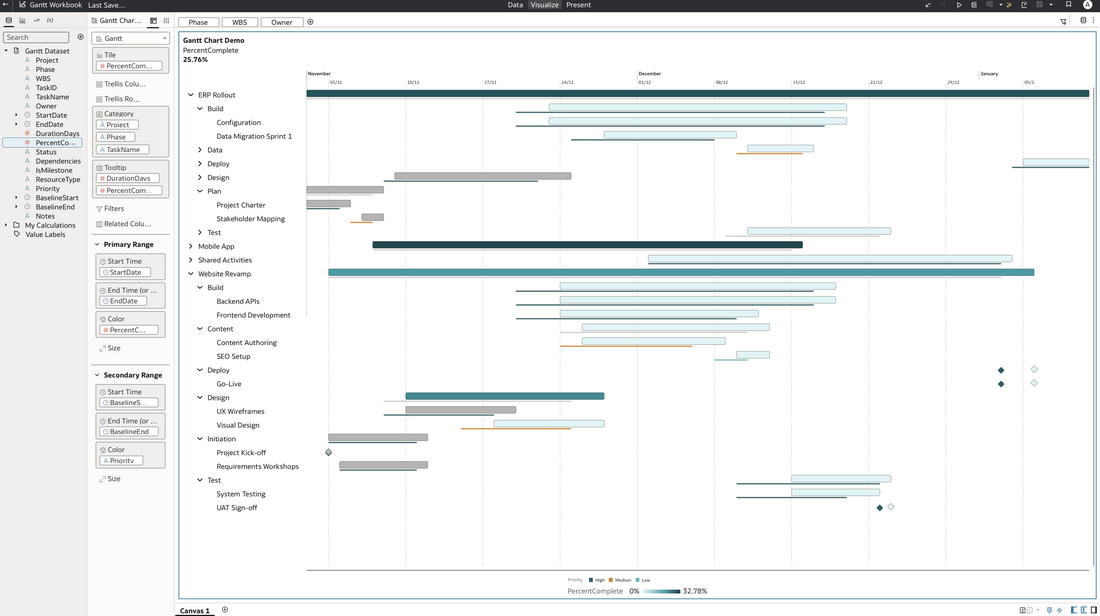
It contains three concurrent projects:
- Website Revamp – A full lifecycle example with UX, build, and content streams.
- ERP Rollout – Multiple workstreams, dependencies, and a go/no-go milestone.
- Mobile App Launch – Parallel iOS and Android sprints with shared backend integration.
It also includes shared dependencies (e.g. a global change freeze) to demonstrate how Gantt timelines can overlap across projects.
Each row in the dataset represents a task, with columns for start/end dates, duration, status, percentage complete, baseline start/end, and dependencies, all mapped for easy use in the Gantt visual.
How to Build the Gantt in Oracle Analytics Cloud
- Upload the dataset (
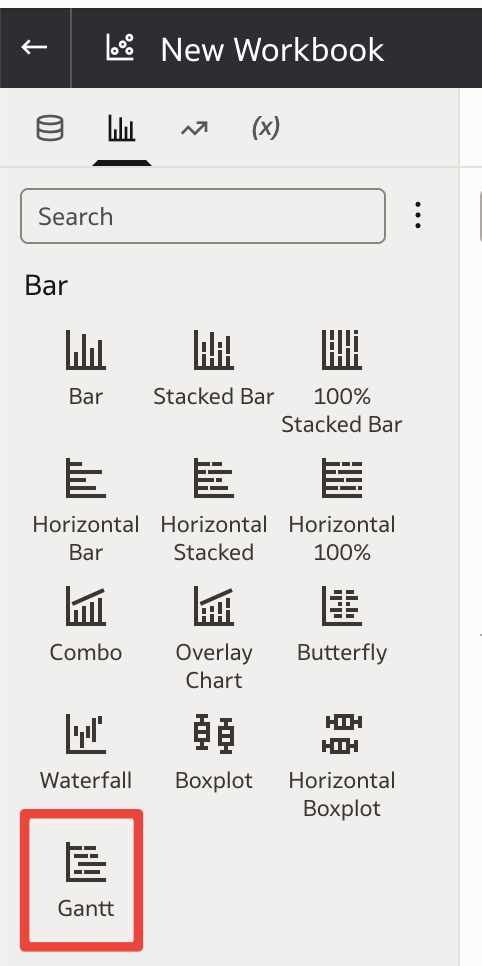
oac_gantt_test_data.csv) to your OAC instance. - Create a new workbook and choose the Gantt Chart visualisation.
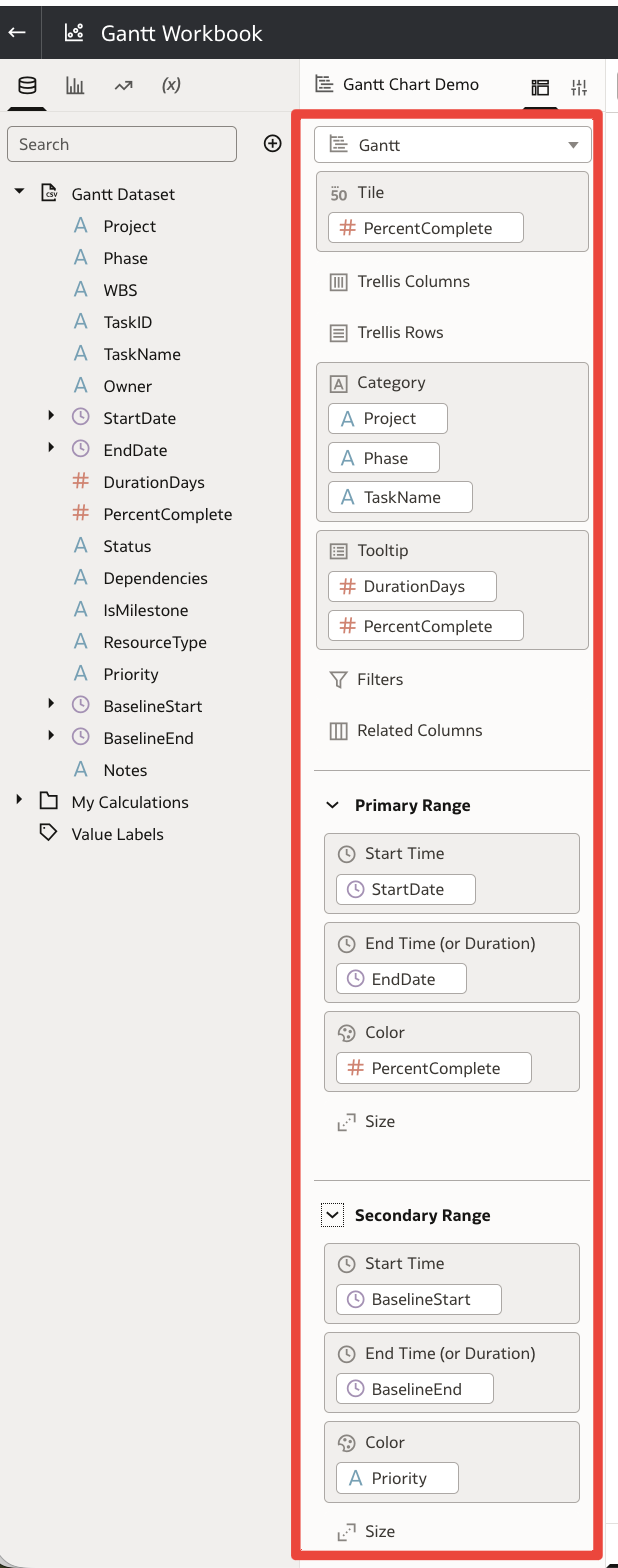
- Map the fields as below.
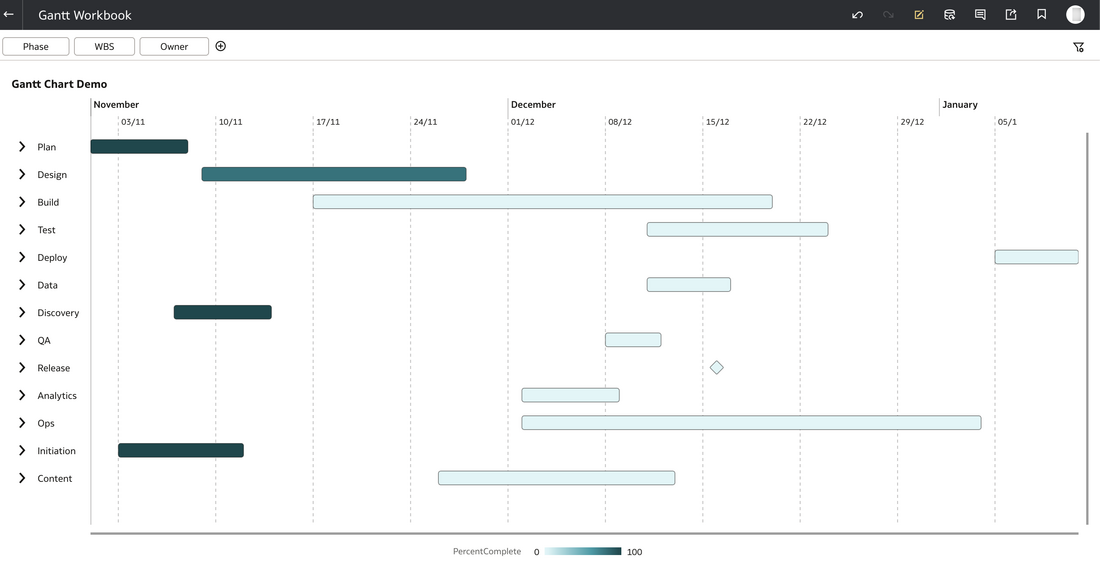
Once configured, you’ll see your projects laid out across a timeline, with bars showing duration, coloured progress, and milestone markers for key events.
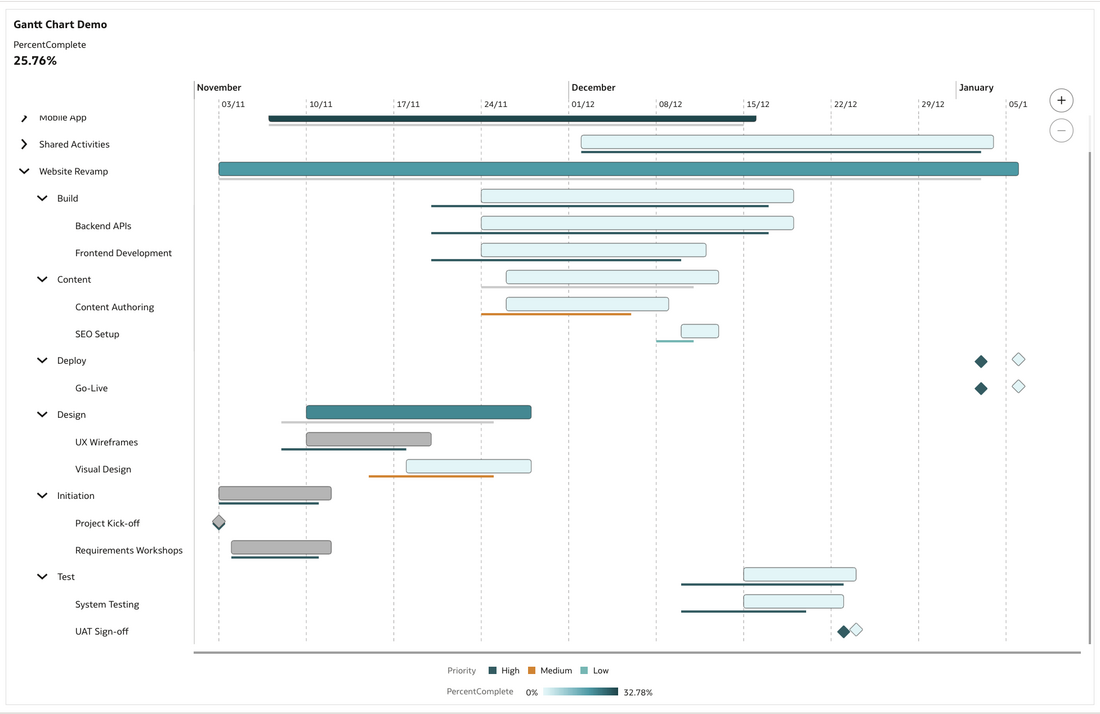
The Gantt chart shown above gives you a timeline view of your project tasks. Each horizontal bar represents a task’s duration from start date to end date, with markers indicating baselines, milestones and percent complete. This makes it easy to see overlaps, dependencies and progress at a glance.
Why This Matters
This update pushes OAC further into operational reporting territory. Instead of switching to tools like Smartsheet, Excel, or Project for schedule reviews, you can keep everything inside OAC, governed, secured, and shared via the same semantic model.
For organisations already integrating delivery data (e.g. from Oracle Fusion PPM, Jira, or Primavera) into OAC, this unlocks a new layer of insight:
- Track schedule health directly in dashboards.
- Correlate project progress with KPIs and costs.
- Identify slippage vs. baseline in real time.
- Present timelines cleanly to executives without exporting to PowerPoint.
Community Demand
This feature has been one of the most upvoted requests on the Oracle Analytics Idea Lab. Many people in the community have asked for a proper Gantt visual for years, especially those working in delivery or programme management roles.
It’s great to see Oracle Product Management not only listen, but execute, and deliver a native visual that feels integrated, performant, and flexible.
Final Thoughts
The Gantt Chart visualisation is a small feature with a big impact. It closes a long-standing gap in Oracle Analytics Cloud and moves the platform closer to a true operational analytics experience.
Whether you’re tracking project sprints, release schedules, or transformation roadmaps, you can now visualise timelines, progress, and dependencies, all in one place, without leaving OAC.